【GEE笔记】提取、下载样本点的时序遥感数据
-
主要功能
- 筛选研究区数据,每日合成
- 递归函数返回每个有数据日期的影像,组成数据集;筛选影像
- 特征提取,值域映射
- 提取样本点数据、批量下载
-
主要流程
在GEE线上的Code Editor编写JavaScript代码实现相关功能,以哨兵2号(Sentinel-2)为例:传入要提取值的样本点,筛选出符合条件的数据之后进行每日合成,提取出的每个矢量点数据包含日期为字段名的属性值,数据以波段或者特征值为文件单位导出
-
代码实现
1、传入矢量点point利用bounds()函数获取矢量点集合的最小外接矩形geometry,时间范围,获取符合时间、空间条件的哨兵2号(Sentinel-2)数据,并进行去云、裁剪和波段选择;然后根据时间范围生成日期序列,将其用于递归函数遍历,构建时间序列影像数据集,每个有数据的日期都会往数据集中添加一个影像数据。
var point = /* color: #d63000 */ee.Geometry.MultiPoint(
    [[121.74174660538993, 40.932878763977484],
    [121.88594216203056, 40.935991162572954],
    [121.78569191788993, 40.893442357539946],
    [121.71702736710868, 40.87475374453443],
    [121.83787697648368, 40.83424364680983],
    [121.93538063859306, 40.87683051769961],
    [121.86671608781181, 40.88825160552172]]);

print(point)
var geometry = point.bounds()
Map.centerObject(geometry);
Map.addLayer(geometry, {}, 'geometry')
var year = 2020
var bandlist = ['B2', 'B3', 'B4', 'B6', 'B8', 'B11', 'B12', 'NDVI', 'EVI', 'SAVI']
var start = ee.Date(year + '-3-01');
var finish = ee.Date(year + '-5-1');

var dataset = ee.ImageCollection('COPERNICUS/S2')
    .filterDate(start, finish)
    .filterBounds(geometry)
    .map(maskS2clouds)
    .select(['B2', 'B3', 'B4', 'B5', 'B6', 'B8', 'B11', 'B12'])

// print("dataset",dataset)

var diff = finish.difference(start, 'day')

// Make a list of all dates
var range = ee.List.sequence(0, diff.subtract(1)).map(function (day) { return start.advance(day, 'day') })
// print("range",range)

//main data
var newcol = ee.ImageCollection(ee.List(range.iterate(day_mosaics, ee.List([]))))
print("newcoln", newcol)
2、计算geometry总面积,利用map遍历每幅影像执行addvalue函数:有值区域面积,相比的值即为有效像元比例,写入每幅影像的元数据,将每幅影像的date字段设置为:日期+vvv+有效像元比例(保留两位数字百分比)
//main data
var newcol = ee.ImageCollection(ee.List(range.iterate(day_mosaics, ee.List([]))))
print("newcoln", newcol)
//yun
var zongxiangyuan = ee.Image.pixelArea().reduceRegion({
    reducer: ee.Reducer.sum(),
    geometry: geometry,
    scale: 10,
    maxPixels: 10e15,
}).get("area");
newcol = newcol.map(addvalue).filter(ee.Filter.gt('yun', 0.8))
    .map(function (img) {
        var date = ee.String(img.get("date"))
        var yun = ee.String(ee.Number(img.get("yun")).multiply(100).toInt())
        return img.set({ "date": date.cat("vvv").cat(yun) })
    })

print("newcoln22", newcol)
//ndvi
var resultCollection = newcol.map(addndvi).map(addevi).map(addsavi)

print("resultCollection", resultCollection)
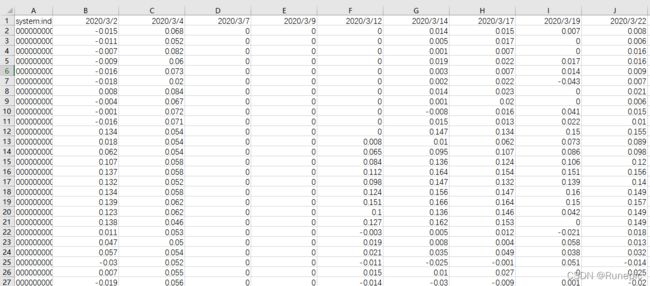
3、设置for循环每次提取一个波段或者特征值的数据集并将其转化为一幅多波段影像(波段数量为有数据日期的数量),利用aggregate_array函数获取数据集的元数据(date)列表,之后赋给生成的多波段影像,之后利用sampleRegions函数提取样本点的值,得到样本点时间序列值,包含所有日期为属性名的条目,导出为CSV文件,命名为:年份+波段名或者特征值名称,
for (var j = 0; j < bandlist.length; j++) {
    var ttt = bandlist[j];
    var tresultCollection = resultCollection.select([ttt]);

    //he cheng
    var datelist = tresultCollection.aggregate_array("date")
    var yunlist = tresultCollection.aggregate_array("yun")

    // print(ui.Chart.array.values(yunlist, 0, datelist))
    var resultimage = tresultCollection.toBands().rename(datelist)
    // print("resultimage",resultimage)
    // Map.addLayer(resultimage.select(0), {}, 'resultimage')

    var pixelValues = resultimage.sampleRegions({
        collection: point,
        scale: 10,
        geometries: true

    });
    print("pixelValues", pixelValues);

    // print(ttt,ui.Chart.feature.byFeature(pixelValues))

    Export.table.toDrive({
        collection: pixelValues,
        description: year + ttt,
        folder: "20220218S2",
        fileFormat: "CSV"
    });

}
涉及函数:
/
///function///
/
function addvalue(img) {
    var mask = img.select(0).mask()
    var xiangyuan = ee.Image.pixelArea().updateMask(mask.select(0)).reduceRegion({
        reducer: ee.Reducer.sum(),
        geometry: geometry,
        scale: 10,
        maxPixels: 10e15,
    }).get("area");
    return img.set({ "yun": ee.Number(xiangyuan).divide(zongxiangyuan) })
}
function guiyi(img) {
    var date = img.get("date")
    var yun = img.get("yun")
    return img//.unitScale(ee.Number(-1), ee.Number(1))
        .multiply(10000).toInt16().set({ "yun": yun, "date": date });
}

// Funtion for iteraton over the range of dates
function day_mosaics(date, newlist) {
    // Cast
    date = ee.Date(date)
    newlist = ee.List(newlist)

    // Filter collection between date and the next day
    var filtered = dataset.filterDate(date, date.advance(1, 'day'))
    var image = ee.Image(filtered.mean()).set({ "date": date.format("YYYY-MM-dd") })

    // Add the mosaic to a list only if the collection has images
    return ee.List(ee.Algorithms.If(filtered.size(), newlist.add(image), newlist))
}
function maskS2clouds(image) {
    var qa = image.select('QA60');

    // Bits 10 and 11 are clouds and cirrus, respectively.
    var cloudBitMask = 1 << 10;
    var cirrusBitMask = 1 << 11;

    // Both flags should be set to zero, indicating clear conditions.
    var mask = qa.bitwiseAnd(cloudBitMask).eq(0)
        .and(qa.bitwiseAnd(cirrusBitMask).eq(0));
    image = image.updateMask(mask);
    return image.clip(geometry)//.set('yun',ee.Number(xiangyuan).divide(zongxiangyuan));
}

function addndvi(img) {
    // Use the normalizedDifference(A, B) to compute (A - B) / (A + B)
    var ndvi = img.normalizedDifference(['B8', 'B4']).rename("NDVI");
    var date = img.get("date")
    // var yun=img.get("yun")
    return img.addBands(ndvi).unmask(0).clip(geometry).set({ "date": date })
}
function addevi(img) {
    var ndvi = img.expression(
        '2.5*((NIR-Red)/(NIR+6*Red-7.5*blue+10000))',
        {
            blue: img.select('B2'),    // 0.452-0.512, BLUE
            Green: img.select('B3'), //0.533-0.590 green
            Red: img.select('B4'),    // 0.636-0.673 μm, RED
            NIR: img.select('B5'),    //  NIR
            SWIR_1: img.select('B6'),    //  SWIR_1
            swir2: img.select('B7'),    //  SWIR_2

        }).rename('EVI');

    var date = img.get("date")
    return img.addBands(ndvi).unmask(0).clip(geometry).set({ "date": date })
}
function addsavi(img) {
    var ndvi = img.expression(
        '1.5*(NIR-Red)/(NIR+Red+0.5)',
        {
            blue: img.select('B2'),    // 0.452-0.512, BLUE
            Green: img.select('B3'), //0.533-0.590 green
            Red: img.select('B4'),    // 0.636-0.673 μm, RED
            NIR: img.select('B5'),    //  NIR
            SWIR_1: img.select('B6'),    //  SWIR_1
            swir2: img.select('B7'),    //  SWIR_2

        }).rename('SAVI');
    var date = img.get("date")
    return img.addBands(ndvi).unmask(0).clip(geometry).set({ "date": date })
}-
结果展示

