echarts的y轴数据显示过长占不下,内容截取,鼠标hover上去显示全部
初始效果:
优化后的效果:
优化点:控制了y轴显示字数,鼠标hover上去显示全部
主要实现思路参考了这位同学的文章:https://www.cnblogs.com/liuboren/p/9040622.html
我是用vue实现的,因为我需要一个页面中显示多个同类型的折线图,所以需要封装一个通用的折线图组件,下面主要说一下我的实现方式:
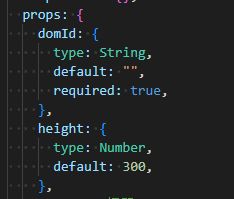
1. 封装一个折线图组件LineEchart,折线图的dom结构如下图所示:
其中包含两个动态的参数:domId,height,这两个参数均由调用该组件的父组件传入
domId由外部传入,主要是为了避免同一个页面多次调用该组件,dom节点id相同
height由外部传入,是为了动态控制折线图的高度
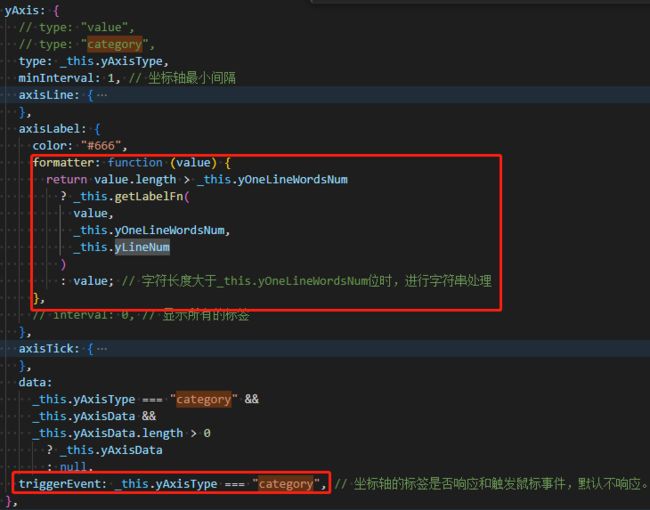
2. 激活y轴的鼠标事件(将 yAxis 的 triggerEvent 设置为 true),并对y轴内容显示的长度做一个截取。
因为我的erchart组件兼容了 value 和 category 两个类型,只在 category 类型的时候才需要触发这个效果,所以我加了判断。你们使用的时候可以直接设置 triggerEvent: true。
其中,
- getLabelFn是我封装的一个字符串处理的方法
- yOneLineWordsNum 表示一行最多显示的字数,
-
yLineNum 表示最多显示的行数
getLabelFn的代码如下所示:
getLabelFn(oriName, column, maxRow = 0) {
      let newName = oriName;
      if (maxRow > 0 && oriName.length > column * maxRow) {
        newName = oriName.slice(0, column * maxRow - 1); // 当字符长度超出最大字数时,对字符进行截取
      }
      const nameLastStr = newName.slice(-1);
      const nameOther = newName.slice(0, -1);
      const str = `(.{${column}})`;
      const reg = new RegExp(str, "g");
      let content =
        newName.length > column
          ? nameOther.replace(reg, "$1\n") + nameLastStr
          : newName; // 文本超出一行的字数,换行
      if (maxRow > 0 && oriName.length > column * maxRow) {
        content = content + "...";
      }
      return content;
    },
3. 自定义extensionFn方法(实现鼠标事件),并调用
简单来说,需要实现3个鼠标事件,分别是:
- 鼠标移入,显示提示信息
- 鼠标移动,动态更新提示框信息
- 鼠标移出,隐藏提示框
extensionFn主要代码如下所示:
extensionFn(mychart, chartDom) {
      const _this = this;
      const tId = `${_this.domId}-tipDom`; // 创建的dom提示框id
      mychart.on("mouseover", function (params) {
        if (
          params.componentType === "yAxis" &&
          params.value.length > _this.yOneLineWordsNum * _this.yLineNum
        ) {
          // 判断是否创建过div框,如果创建过就不再创建了
          let tipDom = document.getElementById(tId);
          if (!(tipDom && chartDom.contains(tipDom))) {
            tipDom = document.createElement("div");
            tipDom.id = tId;
            tipDom.className = "tooltip-box";
            chartDom.appendChild(tipDom);
          }
          tipDom.style.display = "block";
          const arr = _this.getTipLocationFn(params);
          tipDom.style.left = arr[0];
          tipDom.style.top = arr[1];
          tipDom.innerHTML = params.value;
        }
      });
      mychart.on("mouseout", function (params) {
        const tipDom = document.getElementById(tId);
        if (tipDom) {
          tipDom.style.display = "none";
        }
      });
      // 鼠标移动时更新提示框的位置
      mychart.on("mousemove", function (params) {
        const tipDom = document.getElementById(tId);
        if (tipDom) {
          const arr = _this.getTipLocationFn(params);
          tipDom.style.left = arr[0];
          tipDom.style.top = arr[1];
        }
      });
    },
其中有几点需要注意:
- 创建的dom提示框id需要和当前的domId绑定,原因在于,一个页面上可能会多次调用该组件,若固定一个字符串,会导致重复,找不到正确的提示框dom。
- tooltip-box 是自定义的提示框样式,我直接将echarts的提示框样式拿过来复用了,代码如下:
::v-deep .tooltip-box { position: absolute; top: 0; overflow: hidden; max-width: 395px; border-style: solid; z-index: 9999999; box-shadow: rgba(0, 0, 0, 0.2) 1px 2px 10px; transition: opacity 0.2s cubic-bezier(0.23, 1, 0.32, 1) 0s, visibility 0.2s cubic-bezier(0.23, 1, 0.32, 1) 0s, transform 0.4s cubic-bezier(0.23, 1, 0.32, 1) 0s; background-color: rgb(255, 255, 255); border-width: 1px; border-radius: 4px; color: rgb(102, 102, 102); font: 14px / 21px "Microsoft YaHei"; padding: 10px; border-color: rgb(255, 255, 255); word-break: break-all; } - getTipLocationFn方法是依据当前鼠标的位置定位提示框的位置,代码如下:
getTipLocationFn(params) {
      const x = `${params.event.offsetX + 10}px`;
      const y = `${params.event.offsetY + 20}px`;
      return [x, y];
    },
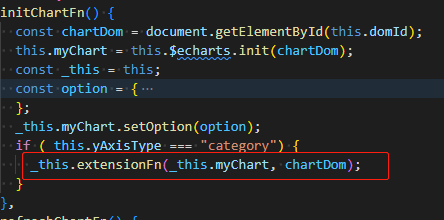
初始化echart时,调用extensionFn方法:
在说遇到的一个小坑,坐标系中间也需要加提示框,效果如下所示:
官方提供的提示框组件是没有换行的,需要自己换行,我这里用的最大宽度及换行属性都没有用,后面发现官方给提示框设置了white-space: nowrap;这个属性是会继承的,所以需要把这个属性覆盖一下


