Android 一步步实现曲线图、折线图、柱状图、雷达图,动态心跳图
本文目录
- 正文
- 1 MPandroidChart效果图
- 2 本文实现的效果图
-
- 2.1 其他开源图表项目
- 3 MPAndroidChart使用教程
-
- 3.1 **引入依赖或导入module**
- 3.2 在布局中定义
- 3.3 显示坐标数据的marker
- 3.4 Activity中初始化设置LineChart
- 3.5 点击坐标轴任意值的回调
- 3.6 图表填充数据
- 3.7 阴影效果fade_red.xml
- 4 线条的四种不同效果实现
-
- 4.1 线条支持的模式
- 4.2 曲线图
- 4.3 折线图
- 4.4 柱状图
- 5 一键清空图标数据
-
- 5.1 后端代码
- 5.2 前端代码
- 6 轨迹线条属性
-
- 6.1 虚线
- 6.2 实线
- 6.3 颜色
- 7 线条图示标属性
-
- 7.1 颜色与形状
- 7.2 形状参数介绍
- 8 图表背景、边框、网格线修改
-
- 8.1 修改背景,去掉边框
- 8.2 取消显示网格
- 8.3 X Y轴值的自定义
- 8.4 线条值的更改
- 9 单表多曲线
- 10 使用MarkerView显示更多详情
- 11 (MP高级进阶)实现动态心跳图
正文
1 MPandroidChart效果图
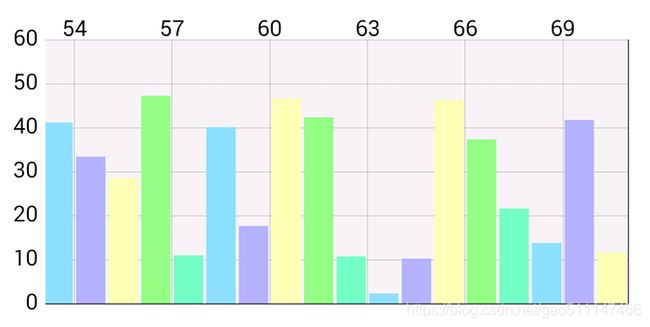
以下是四种典型的基于MP框架实现的曲线图
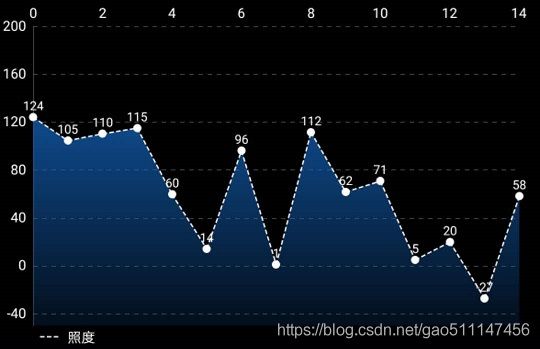
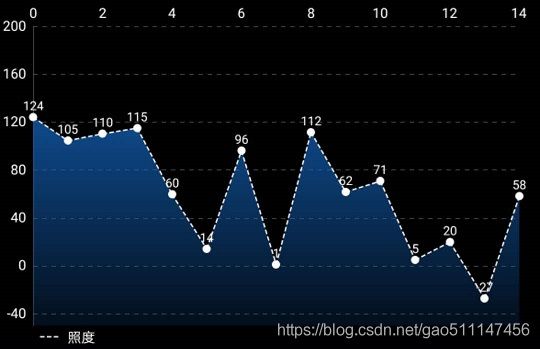
2 本文实现的效果图
2.1 其他开源图表项目
- MPAndroidChart ★ 31.6K 安卓图表解决方案
- hellocharts-android ★ 7K Android图表库
- WilliamChart ★ 4.4K 在应用程序中实现图表的Android库
- GraphView ★ 2.5K 通过编程创建灵活好看的图表
- android-DecoView-charting ★ 958 实现高度可配置动画环形图表
- RadarChart ★ 350+ 自由定制旋转交互的Android雷达图
3 MPAndroidChart使用教程
3.1 引入依赖或导入module
repositories {
        maven { url "https://jitpack.io" }
    }

compile 'com.github.PhilJay:MPAndroidChart:v3.0.2'
3.2 在布局中定义
    <com.github.mikephil.charting.charts.LineChart
        android:id="@+id/chart1"
        android:layout_width="match_parent"
        android:layout_height="match_parent"
        android:layout_above="@+id/seekBar1" />
3.3 显示坐标数据的marker
<RelativeLayout xmlns:android="http://schemas.android.com/apk/res/android"
    xmlns:tools="http://schemas.android.com/tools"
    android:layout_width="wrap_content"
    android:layout_height="40dp"
    android:background="@drawable/marker2"
    tools:ignore="Overdraw">


    <TextView
        android:id="@+id/tvContent"
        android:layout_width="wrap_content"
        android:layout_height="wrap_content"
        android:layout_centerHorizontal="true"
        android:layout_marginTop="7dp"
        android:layout_marginLeft="5dp"
        android:layout_marginRight="5dp"
        android:text=""
        android:textSize="12sp"
        android:textColor="@android:color/white"
        android:ellipsize="end"
        android:singleLine="true"
        android:textAppearance="?android:attr/textAppearanceSmall" />

RelativeLayout>
3.4 Activity中初始化设置LineChart
private LineChart chart;
//设置 LineChart
{
	chart = findViewById(R.id.chart1);
	//设置背景
	chart.setBackgroundColor(Color.WHITE);
	//是否显示坐标数据
	chart.getDescription().setEnabled(false);
	//是否支持双击
	chart.setTouchEnabled(true);
	//值选中回调监听
	chart.setOnChartValueSelectedListener(this);
	//是否绘制网格背景
    chart.setDrawGridBackground(false);
	//显示坐标数据的box
    MyMarkerView mv = new MyMarkerView(this, R.layout.custom_marker_view);
	// Set the marker to the chart
    mv.setChartView(chart);
    chart.setMarker(mv);
    // enable scaling and dragging
    chart.setDragEnabled(true);
    chart.setScaleEnabled(true);
    // chart.setScaleXEnabled(true);
    // chart.setScaleYEnabled(true);
	// force pinch zoom along both axis
    chart.setPinchZoom(true);
    }
	//设置 坐标轴 轴线的粗细
	XAxis xAxis;
    {   // X-Axis Style //
        xAxis = chart.getXAxis();
		// vertical grid lines
        xAxis.enableGridDashedLine(10f, 10f, 0f);
    }
    YAxis yAxis;
    {   // // Y-Axis Style // //
        yAxis = chart.getAxisLeft();
        // disable dual axis (only use LEFT axis)
        chart.getAxisRight().setEnabled(false);
        // horizontal grid lines
        yAxis.enableGridDashedLine(10f, 10f, 0f);
        // axis range
        yAxis.setAxisMaximum(200f);
        yAxis.setAxisMinimum(-50f);
    }

		{   // // Create Limit Lines // //
        LimitLine llXAxis = new LimitLine(9f, "Index 10");
        llXAxis.setLineWidth(4f);
        llXAxis.enableDashedLine(10f, 10f, 0f);
        llXAxis.setLabelPosition(LimitLabelPosition.RIGHT_BOTTOM);
        llXAxis.setTextSize(10f);
        llXAxis.setTypeface(tfRegular);

		//
        LimitLine ll1 = new LimitLine(150f, "Upper Limit");
        ll1.setLineWidth(4f);
        ll1.enableDashedLine(10f, 10f, 0f);
        ll1.setLabelPosition(LimitLabelPosition.RIGHT_TOP);
        ll1.setTextSize(10f);
        ll1.setTypeface(tfRegular);

        LimitLine ll2 = new LimitLine(-30f, "Lower Limit");
        ll2.setLineWidth(4f);
        ll2.enableDashedLine(10f, 10f, 0f);
        ll2.setLabelPosition(LimitLabelPosition.RIGHT_BOTTOM);
        ll2.setTextSize(10f);
        ll2.setTypeface(tfRegular);

        // draw limit lines behind data instead of on top
        yAxis.setDrawLimitLinesBehindData(true);
        xAxis.setDrawLimitLinesBehindData(true);

        // add limit lines
        yAxis.addLimitLine(ll1);
        yAxis.addLimitLine(ll2);
        //xAxis.addLimitLine(llXAxis);

		// add data
        setData(45, 180);

        // draw points over time
        chart.animateX(1500);

        // get the legend (only possible after setting data)
        Legend l = chart.getLegend();

        // draw legend entries as lines
        l.setForm(LegendForm.LINE);
        }
3.5 点击坐标轴任意值的回调
首先在初始化时设置 回调监听
chart.setOnChartValueSelectedListener(this);
然后继承OnChartValueSelectedListener接口并重写以下方法
	//******************OnChartValueSelectedListener 需要重写以下方法*****************//

    @Override
    public void onValueSelected(Entry e, Highlight h) {
        Log.i("Entry selected", e.toString());
        Log.i("LOW HIGH", "low: " + chart.getLowestVisibleX() + ", high: " + chart.getHighestVisibleX());
        Log.i("MIN MAX", "xMin: " + chart.getXChartMin() + ", xMax: " + chart.getXChartMax() + ", yMin: " + chart.getYChartMin() + ", yMax: " + chart.getYChartMax());
    }

    @Override
    public void onNothingSelected() {
        Log.i("Nothing selected", "Nothing selected.");
    }
      //******************OnChartValueSelectedListener 需要重写以上方法*****************//
3.6 图表填充数据
    private void setData(int count, float range) {

        ArrayList<Entry> values = new ArrayList<>();

        for (int i = 0; i < count; i++) {

            float val = (float) (Math.random() * range) - 30;
            //这里的star可以替换为你自己项目的图标
            values.add(new Entry(i, val, getResources().getDrawable(R.drawable.star)));
        }

        LineDataSet set1;

        if (chart.getData() != null &&
                chart.getData().getDataSetCount() > 0) {
            set1 = (LineDataSet) chart.getData().getDataSetByIndex(0);
            set1.setValues(values);
            set1.notifyDataSetChanged();
            chart.getData().notifyDataChanged();
            chart.notifyDataSetChanged();
        } else {
            // create a dataset and give it a type
            set1 = new LineDataSet(values, "DataSet 1");

            set1.setDrawIcons(false);

            // draw dashed line
            set1.enableDashedLine(10f, 5f, 0f);

            // black lines and points
            set1.setColor(Color.BLACK);
            set1.setCircleColor(Color.BLACK);

            // line thickness and point size
            set1.setLineWidth(1f);
            set1.setCircleRadius(3f);

            // draw points as solid circles
            set1.setDrawCircleHole(false);

            // customize legend entry
            set1.setFormLineWidth(1f);
            set1.setFormLineDashEffect(new DashPathEffect(new float[]{10f, 5f}, 0f));
            set1.setFormSize(15.f);

            // text size of values
            set1.setValueTextSize(9f);

            // draw selection line as dashed
            set1.enableDashedHighlightLine(10f, 5f, 0f);

            // set the filled area
            set1.setDrawFilled(true);
            set1.setFillFormatter(new IFillFormatter() {
                @Override
                public float getFillLinePosition(ILineDataSet dataSet, LineDataProvider dataProvider) {
                    return chart.getAxisLeft().getAxisMinimum();
                }
            });

            // set color of filled area
            if (Utils.getSDKInt() >= 18) {
                // drawables only supported on api level 18 and above

                Drawable drawable = ContextCompat.getDrawable(this, R.drawable.fade_red);
                set1.setFillDrawable(drawable);
            } else {
                set1.setFillColor(Color.BLACK);
            }

            ArrayList<ILineDataSet> dataSets = new ArrayList<>();
            dataSets.add(set1); // add the data sets

            // create a data object with the data sets
            LineData data = new LineData(dataSets);

            // set data
            chart.setData(data);
        }
    }
3.7 阴影效果fade_red.xml
<shape xmlns:android="http://schemas.android.com/apk/res/android">
    <gradient
        android:angle="90"
        android:startColor="#3C0D3E77"
        android:endColor="#1565C0" />
shape>
4 线条的四种不同效果实现
4.1 线条支持的模式
    public enum Mode {
        LINEAR,
        STEPPED,
        CUBIC_BEZIER,
        HORIZONTAL_BEZIER
    }
4.2 曲线图
在setData方法中配置LineDataSet的属性
LineDataSet set1;
	set1 = new LineDataSet(values, "照度");
            set1.setMode(LineDataSet.Mode.CUBIC_BEZIER);
4.3 折线图
在setData方法中配置LineDataSet的属性
LineDataSet set1;
	set1 = new LineDataSet(values, "照度");
            set1.setMode(LineDataSet.Mode.LINEAR);
4.4 柱状图
在setData方法中配置LineDataSet的属性
LineDataSet set1;
	set1 = new LineDataSet(values, "照度");
            set1.setMode(LineDataSet.Mode.STEPPED);
5 一键清空图标数据
5.1 后端代码
tvDelete = findViewById(R.id.delete);
        tvDelete.setOnClickListener(new View.OnClickListener() {
            @Override
            public void onClick(View v) {
                values.clear();
                chart.clearValues();
                chart.notifyDataSetChanged();
            }
        });
5.2 前端代码
<FrameLayout xmlns:android="http://schemas.android.com/apk/res/android"
    xmlns:app="http://schemas.android.com/apk/res-auto"
    xmlns:tools="http://schemas.android.com/tools"
    android:layout_width="match_parent"
    android:layout_height="match_parent"
    android:background="#121212"
    android:orientation="vertical">

    <com.github.mikephil.charting.charts.LineChart
        android:id="@+id/chart1"
        android:layout_width="match_parent"
        android:layout_height="match_parent" />
    <TextView
        android:id="@+id/delete"
        android:layout_width="wrap_content"
        android:layout_height="wrap_content"
        android:text="删除"
        android:layout_margin="25dp"
        android:textColor="@color/white"/>

FrameLayout>
6 轨迹线条属性
6.1 虚线
// draw dashed line
set1.enableDashedLine(10f, 3f, 0f);//参数1 虚线段长度 参数2 虚线段间距
6.2 实线
set1.enableDashedLine(10f, 0f, 0f);//参数1 虚线段长度 参数2 虚线段间距
6.3 颜色
// black lines and points
set1.setColor(getResources().getColor(R.color.backgroup_yellow));
set1.setCircleColor(getResources().getColor(R.color.backgroup_yellow));
7 线条图示标属性
7.1 颜色与形状
// get the legend (only possible after setting data)
        Legend chartLegend = chart.getLegend();
        chartLegend.setTextColor(Color.WHITE);
        // draw legend entries as lines
        chartLegend.setForm(Legend.LegendForm.SQUARE);
7.2 形状参数介绍
public enum LegendForm {

        NONE,//无图
        EMPTY,//无图但占据view位置
        DEFAULT,//默认形状
        SQUARE,//方形
        CIRCLE,//⚪
        LINE//线
    }
    //
    public enum LegendHorizontalAlignment {
        LEFT, CENTER, RIGHT
    }

    public enum LegendVerticalAlignment {
        TOP, CENTER, BOTTOM
    }

    public enum LegendOrientation {
        HORIZONTAL, VERTICAL
    }

    public enum LegendDirection {
        LEFT_TO_RIGHT, RIGHT_TO_LEFT
    }
8 图表背景、边框、网格线修改
8.1 修改背景,去掉边框
lineChart.setBackgroundColor(Color.WHITE);
//是否显示边界
lineChart.setDrawBorders(false);
8.2 取消显示网格
lineChart.setDrawGridBackground(false);
xAxis.setDrawGridLines(false);
rightYaxis.setDrawGridLines(false);
leftYAxis.setDrawGridLines(true);
设置X Y轴网格线为虚线(实体线长度、间隔距离、偏移量:通常使用 0)
leftYAxis.enableGridDashedLine(10f, 10f, 0f);
8.3 X Y轴值的自定义
原理: 重写值方法,返回自定义格式字体,例如300重写为300斤
xAxis.setValueFormatter(new IAxisValueFormatter() {
    @Override
    public String getFormattedValue(float value, AxisBase axis) {
        return value + "斤";
        // todo 你自己的值显示方式
    }
});
8.4 线条值的更改
原理: 重写线条值方法,返回自定义格式字体,例如30重写为30%
lineDataSet.setValueFormatter(new IValueFormatter() {
    @Override
    public String getFormattedValue(float value, Entry entry, int dataSetIndex, ViewPortHandler viewPortHandler) {
        return value  + "%";
    }
});
9 单表多曲线
一个LineDataSet就是一条曲线,需要两条曲线的时候 在创建一个LineDataSet 添加进去即可,这里封装为一个方法
/**
 * 添加曲线
 */
private void addLine(List<YourBean> yourBeanList, String name, int color) {
    List<Entry> entries = new ArrayList<>();
    for (int i = 0; i < yourBeanList.size(); i++) {
        String yourBean = yourBeanList.get(i);
        Entry entry = new Entry(i, (float) yourBean.getEntry());
        entries.add(entry);
    }
    // 每一个LineDataSet代表一条线
    LineDataSet lineDataSet = new LineDataSet(entries, name);
    initLineDataSet(lineDataSet, color, LineDataSet.Mode.LINEAR);
    lineChart.getLineData().addDataSet(lineDataSet);
    lineChart.invalidate();
}
然后调用改方法即可添加曲线,还有一种替代方法使用框架自带的方法 showLineChart方法。
showLineChart(list, "温度曲线", getResources().getColor(R.color.blue));

List<shiduBean> shiduBeanList = ...//todo 你自己的beanList
addLine(indexBeanList, "湿度曲线", getResources().getColor(R.color.orange));
10 使用MarkerView显示更多详情
MyMarkerView mv = new MyMarkerView(getContext(), R.layout.custom_marker_view);

            // Set the marker to the chart
            mv.setChartView(chart);
            chart.setMarker(mv);
R.layout.custom_marker_view
<RelativeLayout xmlns:android="http://schemas.android.com/apk/res/android"
    xmlns:tools="http://schemas.android.com/tools"
    android:layout_width="wrap_content"
    android:layout_height="40dp"
    android:background="@drawable/marker2"
    tools:ignore="Overdraw">

    <TextView
        android:id="@+id/tvContent"
        android:layout_width="wrap_content"
        android:layout_height="wrap_content"
        android:layout_centerHorizontal="true"
        android:layout_marginTop="7dp"
        android:layout_marginLeft="5dp"
        android:layout_marginRight="5dp"
        android:text=""
        android:textSize="12sp"
        android:textColor="@android:color/white"
        android:ellipsize="end"
        android:singleLine="true"
        android:textAppearance="?android:attr/textAppearanceSmall" />

RelativeLayout>
11 (MP高级进阶)实现动态心跳图
实际使用中我们经常需要实现股票走势图等实时动态更新的曲线。其具体有如下特征:
- 不需要显示很多点,例如手机屏幕显示10个点为佳
- Y轴值不需要显示过多且能自动更新为一个动态连续区间
- X轴值随着时间/次数递增且仅保留10+个轴点
- 绘制的曲线大于10+个点时先进先消
- 动态曲线始终位于表格中心且不断调整
接下来我们看如何实现满足以上要求的曲线图绘制
下面是我在项目中写的一个添加点的方法,注意不能完全复制到你自己的项目中需要剔除无关方法和变量
public synchronized void addLineEntry() {

        LightBean lightBean = ((MainActivity) getActivity()).getCurrentLightBean();
        if (lightBean == null) {

            ToastUtil.showToastLong("请先连接设备");
            return;

        }

        float val = 0;
        if ((this instanceof ManualColorTemperatureFragment)||(this instanceof AutoColorTemperatureFragment)){
            val = lightBean.getColorTemperature();

            if (maxColorTemperatureValue < val) {
                maxColorTemperatureValue = val;
                float charValue = maxColorTemperatureValue+500;

/******************************实现第一步**********************************/
                yAxis.resetAxisMaximum();//自动更新Y轴最大值
                yAxis.resetAxisMinimum();//自动更新Y轴最小值
/**************************************************************************/
            }

        }

        if ((this instanceof ManualIlluminanceFragment)||(this instanceof AutoIlluminanceFragment)) {
            val = lightBean.getIllumination();
            if (maxIlluuminanceValue < val) {

                maxIlluuminanceValue = val;
                float charValue = maxIlluuminanceValue*2;
                yAxis.resetAxisMaximum();
                yAxis.resetAxisMinimum();
            }
        }
/******************************实现第二步**********************************/
        if (valuesFloat.size()>=12)valuesFloat.remove(0);
        valuesFloat.add(val);
        pointCount += 1;
        currentEntry = new Entry(pointCount, val);
        set1.addEntry(currentEntry);

        if (set1.getEntryCount()>=12)set1.removeEntry(0);//大于10+个点就删除第一个点
        getActivity().runOnUiThread(() -> {//在UI线程操作动态刷新

            set1.notifyDataSetChanged();
            chart.getData().notifyDataChanged();//更新曲线图数据
            chart.notifyDataSetChanged();//刷新表
            chart.moveViewToX(pointCount);//更新X轴位置

        });
/**************************************************************************/
        setAvg();
        if (this instanceof ManualColorTemperatureFragment)
            ((ManualFragment) getParentFragment()).addDataListView();
    }


