使用均值漂移来量化带宽分类数据
均值漂移概念
均值漂移的基本概念:沿着密度上升方向寻找聚簇点,其计算过程如下:
1 均值漂移算法首先找到一个中心点center(随机选择),然后根据半径划分一个范围
把这个范围内的点输入簇x的标记个数加1
2 在这个范围内,计算其它点到这个点的平均距离,并把这个平均距离当成偏移量 shift
3 把中心点center 移动偏移量 shift 个单位,当成新的中心点
4 重复上述步骤直到 shift小于一定阈值,即收敛
5 如果当前簇x的center和另一个簇x2的center距离小于一定阈值,则把当前簇归类为x2,否则聚类的类别+1
6 重复遍历所有点
其核心作用,自动分类,虽然人眼一眼就能看到大概的目标分类,但是在计算机里面,无法有感官计算,通过数值计算才能分别数据
使用sklearn 中的均值漂移函数来分类
1 生成等差数据看看,
我们使用np.linspace 去生成等差数列,用a,b 分别代表x轴,y轴,用list(zip) 变成散点
estimate_bandwidth 函数用来量化带宽
import numpy as np
from matplotlib import pyplot as plt
from sklearn.cluster import MeanShift, estimate_bandwidth
from sklearn.cluster.tests.common import generate_clustered_data

a=np.linspace(0,100,15)
b=np.linspace(20,120,15)
#c=np.linspace(300,599,20)
print(a)
print(b)
c=list(zip(a,b))
print(c)
X = c

 #quantile 控制是否同一类别的距离
bandwidth = estimate_bandwidth(X, quantile=0.3, n_samples=len(X))
print(bandwidth)


meanshift = MeanShift(bandwidth=bandwidth, bin_seeding=True)  # 构建对象
meanshift.fit(X)
labels = meanshift.labels_

print(np.unique(labels))

fig, ax = plt.subplots()
cluster_num = len(np.unique(labels))  # label的个数,即自动划分的族群的个数
for i in range(0, cluster_num):
     x = []
     y = []
     for ind, label in enumerate(labels):
         if label == i:
             x.append(X[ind][0])
             y.append(X[ind][1])
     ax.scatter(x, y, s=1)

plt.show()

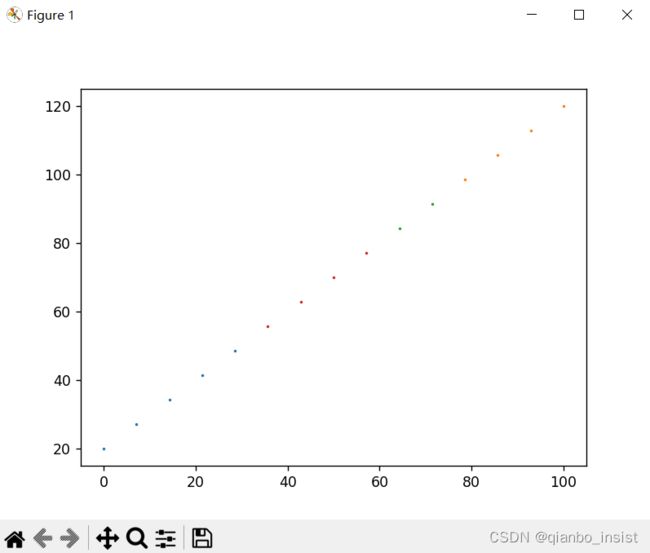
即使是等差数列我们也可以看到sklearn也能帮我们分类,图中可以看到根据颜色分成了四类
,我们使用自己造的数据来形成数据,像下面这样的数组
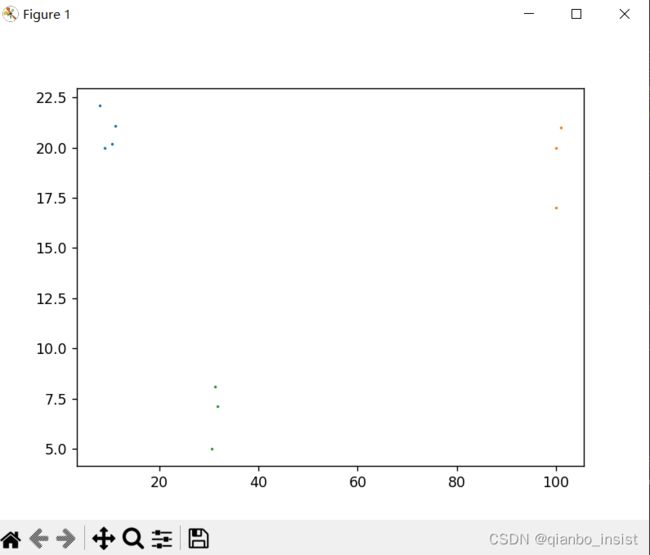
X = [[10.5,20.2], [11.1,21.1],[9,20],[8.0,22.1],[30.5,5.0],[31.7,7.1],[31.2,8.1],[100,20],[101,21],[100,17]]
打印出来的分类为[0,1,2] , 为三类,图中可以看出,确实如此。

使用函数生成
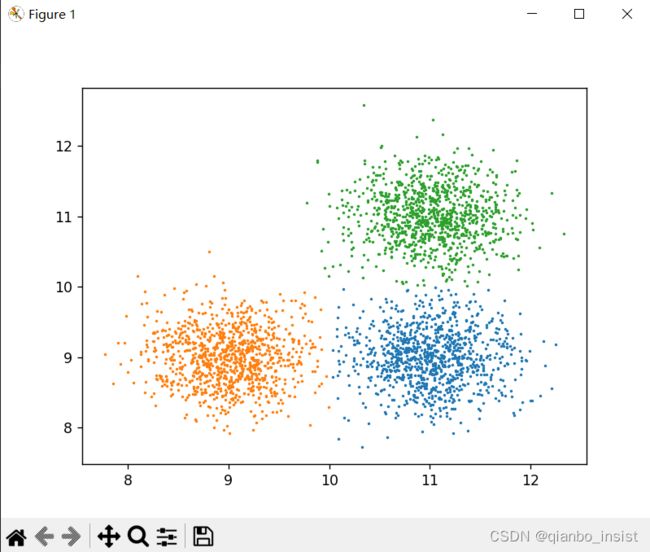
sklearn 有一个函数generate_clustered_data,生成族数据,为了演示,我们不使用手工造数据
X = generate_clustered_data(seed=1, n_samples_per_cluster=1000)
import numpy as np
from matplotlib import pyplot as plt
from sklearn.cluster import MeanShift, estimate_bandwidth
from sklearn.cluster.tests.common import generate_clustered_data

a=np.linspace(0,100,15)
b=np.linspace(20,120,15)
#c=np.linspace(300,599,20)
print(a)
print(b)
c=list(zip(a,b))
print(c)


X = generate_clustered_data(seed=1, n_samples_per_cluster=1000)
#X = [[10.5,20.2], [11.1,21.1],[9,20],[8.0,22.1],[30.5,5.0],[31.7,7.1],[31.2,8.1],[100,20],[101,21],[100,17]]
#X = c

 #quantile 控制是否同一类别的距离
bandwidth = estimate_bandwidth(X, quantile=0.3, n_samples=len(X))
print(bandwidth)


meanshift = MeanShift(bandwidth=bandwidth, bin_seeding=True)  # 构建对象
meanshift.fit(X)
labels = meanshift.labels_

print(np.unique(labels))

fig, ax = plt.subplots()
cluster_num = len(np.unique(labels))  # label的个数,即自动划分的族群的个数
for i in range(0, cluster_num):
     x = []
     y = []
     for ind, label in enumerate(labels):
         if label == i:
             x.append(X[ind][0])
             y.append(X[ind][1])
     ax.scatter(x, y, s=1)

plt.show()
代码非常简单,用好sklearn就行了
