- Golang之Context详解
高冷小伙
Golang语言golang开发语言后端设计规范性能
引言之前对context的了解比较浅薄,只知道它是用来传递上下文信息的对象;对于Context本身的存储、类型认识比较少。最近又正好在业务代码中发现一种用法:在每个协程中都会复制一份新的局部context对象,想探究下这种写法在性能上有没有弊端。jobList:=[]func()error{s.task1,s.task2,s.task3,s.task4,}iferr:=gconc.GConcurr
- 介绍下不同语言的异常处理机制
高冷小伙
异常错误GolangJavaPHPRust
Golang在Go语言中,有两种用于处于异常的机制,分别是error和panic;panicpanic是Go中处理异常情况的机制,用于表示程序遇到了无法恢复的错误,需要终止执行。使用场景程序出现严重的不符合预期的问题,比如数组越界访问、map并发操作;程序的初始化或关键部分出现问题,比如配置文件丢失或数据库连接失败。示例代码packagemainimport("fmt")//会引发panic的函数
- Golang的Aes加解密工具类
张声录1
golang开发语言后端
packagemainimport("bytes""crypto/aes""crypto/sha1""encoding/binary""encoding/hex""fmt")//SHA1PRNG模拟Java的SHA1PRNG算法typeSHA1PRNGstruct{state[sha1.Size]bytecounteruint32indexint}//NewSHA1PRNG使用种子初始化SHA1P
- go install 报错 cannot find package“xxx/xxx“
柠是柠檬的檬
gogolanggithubgit
问题:goinstall安装包的时候,如果本地环境没有对应的包,就会报错cannotfindpackage“xxx/xxx“。解决:如果可以的话可以执行goget来获取对应的包。mkdir-p$GOPATH/src/google.golang.org/cd$GOPATH/src/google.golang.org/gogetgoogle.golang.org/grpc没有工具的话,就需要把对应的包
- 分布式服务监控
点滴~
分布式
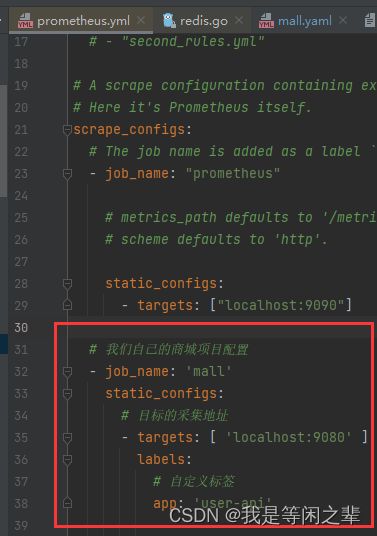
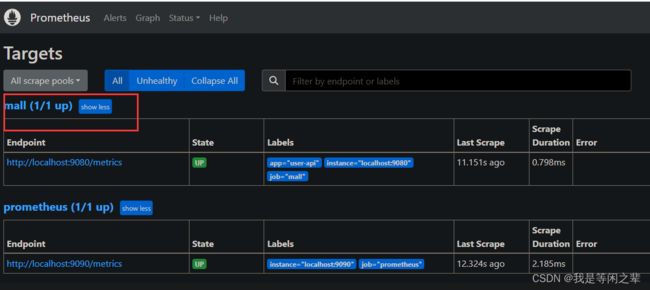
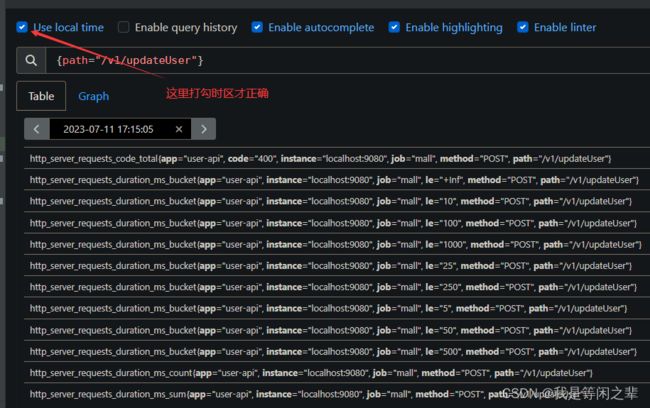
目录分布式服务监控CAT(CentralApplicationTracking)监控对象和指标分布式服务监控分布式服务监控在保障分布式系统稳定运行中至关重要,通过各类监控组件对关键指标进行监测,能及时发现并解决问题。下面将从监控组件、其优缺点、监控指标及其作用展开介绍。监控组件Prometheus:一个开源的系统监控和报警工具包。它采用拉取式采集数据,支持多种数据采集方式,如直接采集应用程序暴露的
- 基于springboot的在线小说阅读平台设计与实现-计算机毕业设计源码+LW文档
qq_375279829
计算机毕业设计程序源码javaspringbootjava数据库
开发语言:Java框架:springbootJDK版本:JDK1.8服务器:tomcat7数据库:mysql5.7(一定要5.7版本)数据库工具:Navicat11开发软件:eclipse/myeclipse/ideaMaven包:Maven3.3.9浏览器:谷歌浏览器数据库代码:DROPTABLEIFEXISTS`discussxiaoshuoxinxi`;/*!40101SET@saved_c
- 【面试指南】golang-map注意事项
梦里是谁N
面试golang职场和发展
map非并发安全的众所周知,go基础类型中的map是非并发安全的,多个goroutine同时对同一个map进行读写操作时,可能会导致并发写问题,packagemainimport("fmt")funcmain(){m:=make(map[string]string)gofunc(){m["a"]="a"}()m["a"]="a1"fmt.Println(m["a"])}我们可以使用gorun-ra
- Python大数据可视化:基于Python的王者荣耀战队的数据分析系统设计与实现_flask+hadoop+spider
m0_74823490
面试学习路线阿里巴巴pythonflaskhadoop
开发语言:Python框架:flaskPython版本:python3.7.7数据库:mysql5.7数据库工具:Navicat11开发软件:PyCharm系统展示管理员登录管理员功能界面比赛信息管理看板展示系统管理摘要本文使用Python与MYSQL技术搭建了一个王者荣耀战队的数据分析系统。对用户提出的功能进行合理分析,然后搭建开发平台以及配置计算机软硬件;通过对数据流图以及系统结构的设计,创建
- 基于Prometheus和Grafana的现代服务器监控体系构建
丁爸
运维服务器
1.简介1.1.概述基于Prometheus和Grafana的现代服务器监控体系是一种高效、灵活的监控解决方案,广泛应用于云计算和微服务架构的环境中。以下是这一监控体系的概述:Prometheus:Prometheus是一个开源的系统监控和警报工具包,由SoundCloud开发并维护。它具有强大的数据收集能力、灵活的查询语言以及与微服务架构的无缝集成。Prometheus的核心概念包括时间序列数据
- Go语言学习笔记——类型转换工具库cast
PPPsych
Go精进学习golang
文章目录Golang类型转换工具库cast简介快速入门安装使用高级转换时间和时长转换时间类型的转换字符串转换为时间时长类型的转换转换为切片ToIntSliceEToStringSliceE转为`map[string]Type`类型Golang类型转换工具库cast简介cast可以在Go中轻松安全地从一种类型转换为另一种类型,cast提供了简单的函数来轻松地将数字转换为字符串,将接口转换为布尔值等。
- Golang笔记—— error 和 panic
haopingbiji
Golang笔记golang开发语言android后端秋招春招开发
大家好,这里是GoodNote,关注公主号:Goodnote,专栏文章私信限时Free。本文详细介绍Golang的两种错误处理机制:error和panic。文章目录Golang的错误处理机制概述`error`特点代码示例基本用法创建`error``panic`特点运行时错误示例`defer`和`recover`的结合使用代码示例基本用法创建`panic``panic`的执行机制`error`和`p
- Golang笔记——Interface类型
m0_74825634
面试学习路线阿里巴巴golang笔记android
大家好,这里是,关注公主号:Goodnote,专栏文章私信限时Free。本文详细介绍Golang的interface数据结构类型,包括基本实现和使用等。文章目录Go语言中的`interface`详解接口定义实现接口空接口`interface{}`示例:空接口的使用interface类型判断1.类型断言(TypeAssertion)语法示例类型转换和类型断言的区别2.类型开关(TypeSwitch)
- Python进阶
weixin_30886233
json数据结构与算法python
注:本文来源于https://docs.pythontab.com/interpy/,逐个实践操作,增加些原文章中未讲述的知识Python进阶《Python进阶》是《IntermediatePython》的中文译本,谨以此献给进击的Python和Python程序员们!前言Python,作为一个"老练"、"小清新"的开发语言,已受到广大才男俊女的喜爱。我们也从最基础的Python粉,经过时间的摧残慢
- 【Golang】用go操作iptables和ipset设置黑白名单
在成都搬砖的鸭鸭
Golanggolang开发语言后端1024程序员节
目录1、背景2、go库下载3、go库和命令行对比4、代码示例【1】定义iptables规则和ipset集合名称常量【2】创建ipset集合【3】创建iptables规则【4】添加条目【5】查看iptables【6】查看ipset5、总结1、背景iptables是linux中一个比较好用的防火墙工具,可以通过它对网络数据包进行管理和过滤,iptables中的四表五链在网上能查到很多文章解释,这里不做
- 深入探讨K8s资源管理和性能优化
磐基Stack专业服务团队
Kuberneteskubernetes性能优化容器
#作者:曹付江文章目录前言:1.监控Kubernetes集群的资源利用率1.1Prometheus1.2Kubernetes度量服务器1.3Grafana1.4自定义指标2.识别资源瓶颈2.1.监控工具2.2.性能剖析2.3Kubernetes事件和日志2.4.群集自动扩展2.5.负载测试3.扩展应用程序以提高性能3.1.水平Pod自动缩放器(HPA)3.2.垂直PodAutoscaler(VPA
- Golang学习笔记_37——外观模式
LuckyLay
Golang学习笔记golang学习笔记设计模式外观模式
Golang学习笔记_34——组合模式Golang学习笔记_35——代理模式Golang学习笔记_36——装饰器模式文章目录外观模式(FacadePattern)详解一、核心概念1.定义2.解决的问题3.核心角色4.类图二、特点分析三、适用场景1.计算机启动流程2.电商下单系统3.智能家居控制四、代码示例(Go语言)五、高级应用1.与单例模式结合2.分层外观设计六、与其他模式对比七、总结外观模式(
- 基于SpringBoot+mybatisplus+vueJS的高校选课系统设计和实现
华子w908925859
springbootvue.js后端
博主介绍:硕士研究生,专注于信息化技术领域开发与管理,会使用java、标准c/c++等开发语言,以及毕业项目实战✌从事基于javaBS架构、CS架构、c/c++编程工作近16年,拥有近12年的管理工作经验,拥有较丰富的技术架构思想、较扎实的技术功底和资深的项目管理经验。先后担任过技术总监、部门经理、项目经理、开发组长、java高级工程师及c++工程师等职位,在工业互联网、国家标识解析体系、物联网、
- Golang面试必问的10大难点,90%开发者栽在第三个!
go
本文精心梳理了一系列面试中具有一定难度的高频Golang问题,其中部分知识点可能你之前未曾深入探究,然而它们却在面试和实际工作中至关重要。包括:Golang的基础语法、并发模型、内存管理等核心知识点。本篇也将深入更多中高级主题,结合企业级应用场景,助你在激烈竞争中脱颖而出。衷心祝愿每一位求职者都能找到心仪的工作。1.Golang有哪些基本数据类型,它们的特点分别是什么?Golang的基本数据类型主
- golang range 的用法
学会了没
golang开发语言后端
在Go语言中,range关键字用于迭代遍历数组(array)、切片(slice)、映射(map)、字符串(string)和通道(channel)中的元素。它的基本语法和用法如下:1.遍历数组/切片nums:=[]int{2,3,4}//同时获取索引和值forindex,value:=rangenums{fmt.Printf(“索引:%d,值:%d\n”,index,value)}//仅获取索引fo
- golang调用deepseekr1
又菜又爱玩呜呜呜~
golang开发语言后端
1.官方文档2.请求看一下因为deepseek官方API的deepssek-r1响应太慢,于是用了腾讯的API来测试funcmain(){cfg:=config.Config{BaseURL:"https://api.lkeap.cloud.tencent.com",APIKey:"API-KEY",HTTPClient:&http.Client{},}//初始化deepseekd:=deepse
- Golang架构直通车——理解协程和Go调度器
No_Game_No_Life_
Golang架构直通车
文章目录进程、线程与协程Go协程:GoroutinesGo协程调度器Go调度器的设计策略为什么Java坚持多线程而不选择协程?协程和Channel的使用建议进程、线程与协程线程或者进程切换会带来大量的系统开销和上下文切换成本,导致严重的系统开销。在之前的文章中,我们提到过切换进程的开销:切换虚拟地址空间(切换页表、页目录以指向新的地址空间)切换内核栈切换硬件上下文虽然线程切换不需要执行第一步(因为
- golang深度学习-基础篇
老狼伙计
golang编程语言云原生学习笔记golang开发语言后端
基础数据结构及类型字符型-stringstring是Go标准库buildin内置的一个基础数据类型。string是由8比特字节的集合,通常不一定是UTF-8编码的文本。string可以为空(长度为0),但不会是nil。stringisthesetofallstringsof8-bitbytes,conventionallybutnotnecessarilyrepresentingUTF-8-enc
- Golang深度学习
老狼伙计
golang编程语言云原生学习笔记golang开发语言
前言在2009年,Google公司发布了一种新的编程语言,名为Go(或称为Golang),旨在提高编程效率、简化并发编程,并提供强大的标准库支持。Go语言的设计者们希望通过Go语言能够解决软件开发中的一些长期存在的问题,比如并发编程的复杂性、垃圾回收机制的效率以及跨平台的兼容性等。以下是Go语言的一些关键背景和特性:并发编程Go语言内置了并发原语,如goroutines和channels,这使得并
- Apache Pinpoint工具介绍
程序员的世界你不懂
效率工具提升apache
ApachePinpoint:分布式系统性能分析与链路追踪一、Pinpoint简介ApachePinpoint是一个开源的分布式追踪系统,专为微服务架构设计,支持HTTP、RPC、MQTT等协议的调用链追踪。其核心功能包括:链路可视化:展示服务间调用关系(调用树、耗时分布)性能分析:定位慢请求、异常错误根源依赖分析:统计服务间流量占比自动化监控:集成Prometheus、Grafana实时告警二、
- Golang `syscall` 包使用大全:开发者必备的底层操作指南
walkskyer
golang标准库golangphp开发语言
Golang`syscall`包使用大全:开发者必备的底层操作指南什么是`syscall`包`syscall`包的使用场景为什么选择`syscall`而不是更高级的包文件操作打开文件:`syscall.Open`读取文件:`syscall.Read`写入文件:`syscall.Write`关闭文件:`syscall.Close`文件权限操作网络操作创建socket:`syscall.Socket`
- HarmonyOS学习第2天: 解锁语言与框架的无限可能
老三不说话、
HarmonyOS开发harmonyos学习华为
HarmonyOS开发语言大盘点HarmonyOS为开发者提供了丰富的开发语言选择,每种语言都有其独特的优势和适用场景,能够满足不同类型应用开发的需求。Java:作为一种广泛使用且成熟的编程语言,Java在HarmonyOS开发中占据重要地位。它拥有卓越的跨平台能力,一次编写,到处运行,这使得开发者能够高效地开发出适用于多种设备的应用。其丰富的API库涵盖了网络、I/O、图形用户界面等多个方面,为
- 跟我一起学Golang从入门到精通《Golang的概述》
互联网-小阿宇
Golang语言golang区块链
Golang的概述什么是程序程序,就是完成某个功能的指令的集合。老板-----------------------------------》秘书1.
- 密码学系列(三):区块链+密码学基础知识
Juno07
密码学区块链
密码学系列(三):区块链+密码学基础知识一、区块链的概念区块链概述区块链的特点区块链变化市场现状二、区块链政策与标准区块链的特点与发展三、区块链的定义区块链的价值四、区块链开发语言五、区块链应用领域补充:一、区块链的概念区块链概述区块链是一个不断增长的记录列表,每一个记录被称为区块,使用密码学技术连接在一起。每个块包含前一个块的密码散链的时间戳和交易数据((通常表示为默克尔树)。因为每个区块都包含
- python开发翻译软件&PDF文档识别转换翻译
Juniper_fly
AI模型PDF格式转换Python开发程序python开发语言
一、通过Helsinki-NLP模型实现离线翻译接口参考文档:https://blog.csdn.net/mzl87/article/details/1271234451.1、开发环境配置系统环境:WIN10开发环境:pycharm开发语言环境:Python3.8.10-64bitpip21.1.1(pip降级:python-mpipinstallpip==21.1.1)常用命令:查看python
- 【GoLang】【算法模板】2、GoLang 算法模板整理
Ypuyu
GoLanggolang算法开发语言
文章目录0、前言1、GoLang算法必会技巧1.1、标准库1.1.1、sort包1.1.2、slice包1.2、数据结构1.2.1、常用数据结构1.2.1.1、优先队列1.2.2、冷门的数据结构1.2.2.1、跳表2、板子2.1、二分2.1.1、lower_bound、upper_bound2.2、字符串2.2.1、kmp0、前言整理一下golang的算法板子,作为备忘录使用。可能有些板子、博文是
- 枚举的构造函数中抛出异常会怎样
bylijinnan
javaenum单例
首先从使用enum实现单例说起。
为什么要用enum来实现单例?
这篇文章(
http://javarevisited.blogspot.sg/2012/07/why-enum-singleton-are-better-in-java.html)阐述了三个理由:
1.enum单例简单、容易,只需几行代码:
public enum Singleton {
INSTANCE;
- CMake 教程
aigo
C++
转自:http://xiang.lf.blog.163.com/blog/static/127733322201481114456136/
CMake是一个跨平台的程序构建工具,比如起自己编写Makefile方便很多。
介绍:http://baike.baidu.com/view/1126160.htm
本文件不介绍CMake的基本语法,下面是篇不错的入门教程:
http:
- cvc-complex-type.2.3: Element 'beans' cannot have character
Cb123456
springWebgis
cvc-complex-type.2.3: Element 'beans' cannot have character
Line 33 in XML document from ServletContext resource [/WEB-INF/backend-servlet.xml] is i
- jquery实例:随页面滚动条滚动而自动加载内容
120153216
jquery
<script language="javascript">
$(function (){
var i = 4;$(window).bind("scroll", function (event){
//滚动条到网页头部的 高度,兼容ie,ff,chrome
var top = document.documentElement.s
- 将数据库中的数据转换成dbs文件
何必如此
sqldbs
旗正规则引擎通过数据库配置器(DataBuilder)来管理数据库,无论是Oracle,还是其他主流的数据都支持,操作方式是一样的。旗正规则引擎的数据库配置器是用于编辑数据库结构信息以及管理数据库表数据,并且可以执行SQL 语句,主要功能如下。
1)数据库生成表结构信息:
主要生成数据库配置文件(.conf文
- 在IBATIS中配置SQL语句的IN方式
357029540
ibatis
在使用IBATIS进行SQL语句配置查询时,我们一定会遇到通过IN查询的地方,在使用IN查询时我们可以有两种方式进行配置参数:String和List。具体使用方式如下:
1.String:定义一个String的参数userIds,把这个参数传入IBATIS的sql配置文件,sql语句就可以这样写:
<select id="getForms" param
- Spring3 MVC 笔记(一)
7454103
springmvcbeanRESTJSF
自从 MVC 这个概念提出来之后 struts1.X struts2.X jsf 。。。。。
这个view 层的技术一个接一个! 都用过!不敢说哪个绝对的强悍!
要看业务,和整体的设计!
最近公司要求开发个新系统!
- Timer与Spring Quartz 定时执行程序
darkranger
springbean工作quartz
有时候需要定时触发某一项任务。其实在jdk1.3,java sdk就通过java.util.Timer提供相应的功能。一个简单的例子说明如何使用,很简单: 1、第一步,我们需要建立一项任务,我们的任务需要继承java.util.TimerTask package com.test; import java.text.SimpleDateFormat; import java.util.Date;
- 大端小端转换,le32_to_cpu 和cpu_to_le32
aijuans
C语言相关
大端小端转换,le32_to_cpu 和cpu_to_le32 字节序
http://oss.org.cn/kernel-book/ldd3/ch11s04.html
小心不要假设字节序. PC 存储多字节值是低字节为先(小端为先, 因此是小端), 一些高级的平台以另一种方式(大端)
- Nginx负载均衡配置实例详解
avords
[导读] 负载均衡是我们大流量网站要做的一个东西,下面我来给大家介绍在Nginx服务器上进行负载均衡配置方法,希望对有需要的同学有所帮助哦。负载均衡先来简单了解一下什么是负载均衡,单从字面上的意思来理解就可以解 负载均衡是我们大流量网站要做的一个东西,下面我来给大家介绍在Nginx服务器上进行负载均衡配置方法,希望对有需要的同学有所帮助哦。
负载均衡
先来简单了解一下什么是负载均衡
- 乱说的
houxinyou
框架敏捷开发软件测试
从很久以前,大家就研究框架,开发方法,软件工程,好多!反正我是搞不明白!
这两天看好多人研究敏捷模型,瀑布模型!也没太搞明白.
不过感觉和程序开发语言差不多,
瀑布就是顺序,敏捷就是循环.
瀑布就是需求、分析、设计、编码、测试一步一步走下来。而敏捷就是按摸块或者说迭代做个循环,第个循环中也一样是需求、分析、设计、编码、测试一步一步走下来。
也可以把软件开发理
- 欣赏的价值——一个小故事
bijian1013
有效辅导欣赏欣赏的价值
第一次参加家长会,幼儿园的老师说:"您的儿子有多动症,在板凳上连三分钟都坐不了,你最好带他去医院看一看。" 回家的路上,儿子问她老师都说了些什么,她鼻子一酸,差点流下泪来。因为全班30位小朋友,惟有他表现最差;惟有对他,老师表现出不屑,然而她还在告诉她的儿子:"老师表扬你了,说宝宝原来在板凳上坐不了一分钟,现在能坐三分钟。其他妈妈都非常羡慕妈妈,因为全班只有宝宝
- 包冲突问题的解决方法
bingyingao
eclipsemavenexclusions包冲突
包冲突是开发过程中很常见的问题:
其表现有:
1.明明在eclipse中能够索引到某个类,运行时却报出找不到类。
2.明明在eclipse中能够索引到某个类的方法,运行时却报出找不到方法。
3.类及方法都有,以正确编译成了.class文件,在本机跑的好好的,发到测试或者正式环境就
抛如下异常:
java.lang.NoClassDefFoundError: Could not in
- 【Spark七十五】Spark Streaming整合Flume-NG三之接入log4j
bit1129
Stream
先来一段废话:
实际工作中,业务系统的日志基本上是使用Log4j写入到日志文件中的,问题的关键之处在于业务日志的格式混乱,这给对日志文件中的日志进行统计分析带来了极大的困难,或者说,基本上无法进行分析,每个人写日志的习惯不同,导致日志行的格式五花八门,最后只能通过grep来查找特定的关键词缩小范围,但是在集群环境下,每个机器去grep一遍,分析一遍,这个效率如何可想之二,大好光阴都浪费在这上面了
- sudoku solver in Haskell
bookjovi
sudokuhaskell
这几天没太多的事做,想着用函数式语言来写点实用的程序,像fib和prime之类的就不想提了(就一行代码的事),写什么程序呢?在网上闲逛时发现sudoku游戏,sudoku十几年前就知道了,学生生涯时也想过用C/Java来实现个智能求解,但到最后往往没写成,主要是用C/Java写的话会很麻烦。
现在写程序,本人总是有一种思维惯性,总是想把程序写的更紧凑,更精致,代码行数最少,所以现
- java apache ftpClient
bro_feng
java
最近使用apache的ftpclient插件实现ftp下载,遇见几个问题,做如下总结。
1. 上传阻塞,一连串的上传,其中一个就阻塞了,或是用storeFile上传时返回false。查了点资料,说是FTP有主动模式和被动模式。将传出模式修改为被动模式ftp.enterLocalPassiveMode();然后就好了。
看了网上相关介绍,对主动模式和被动模式区别还是比较的模糊,不太了解被动模
- 读《研磨设计模式》-代码笔记-工厂方法模式
bylijinnan
java设计模式
声明: 本文只为方便我个人查阅和理解,详细的分析以及源代码请移步 原作者的博客http://chjavach.iteye.com/
package design.pattern;
/*
* 工厂方法模式:使一个类的实例化延迟到子类
* 某次,我在工作不知不觉中就用到了工厂方法模式(称为模板方法模式更恰当。2012-10-29):
* 有很多不同的产品,它
- 面试记录语
chenyu19891124
招聘
或许真的在一个平台上成长成什么样,都必须靠自己去努力。有了好的平台让自己展示,就该好好努力。今天是自己单独一次去面试别人,感觉有点小紧张,说话有点打结。在面试完后写面试情况表,下笔真的好难,尤其是要对面试人的情况说明真的好难。
今天面试的是自己同事的同事,现在的这个同事要离职了,介绍了我现在这位同事以前的同事来面试。今天这位求职者面试的是配置管理,期初看了简历觉得应该很适合做配置管理,但是今天面
- Fire Workflow 1.0正式版终于发布了
comsci
工作workflowGoogle
Fire Workflow 是国内另外一款开源工作流,作者是著名的非也同志,哈哈....
官方网站是 http://www.fireflow.org
经过大家努力,Fire Workflow 1.0正式版终于发布了
正式版主要变化:
1、增加IWorkItem.jumpToEx(...)方法,取消了当前环节和目标环节必须在同一条执行线的限制,使得自由流更加自由
2、增加IT
- Python向脚本传参
daizj
python脚本传参
如果想对python脚本传参数,python中对应的argc, argv(c语言的命令行参数)是什么呢?
需要模块:sys
参数个数:len(sys.argv)
脚本名: sys.argv[0]
参数1: sys.argv[1]
参数2: sys.argv[
- 管理用户分组的命令gpasswd
dongwei_6688
passwd
NAME: gpasswd - administer the /etc/group file
SYNOPSIS:
gpasswd group
gpasswd -a user group
gpasswd -d user group
gpasswd -R group
gpasswd -r group
gpasswd [-A user,...] [-M user,...] g
- 郝斌老师数据结构课程笔记
dcj3sjt126com
数据结构与算法
<<<<<<<<<<<<<<<<<<<<<<<<<<<<<<<<<<<<<<<<<<<<<<<<<<
- yii2 cgridview加上选择框进行操作
dcj3sjt126com
GridView
页面代码
<?=Html::beginForm(['controller/bulk'],'post');?>
<?=Html::dropDownList('action','',[''=>'Mark selected as: ','c'=>'Confirmed','nc'=>'No Confirmed'],['class'=>'dropdown',])
- linux mysql
fypop
linux
enquiry mysql version in centos linux
yum list installed | grep mysql
yum -y remove mysql-libs.x86_64
enquiry mysql version in yum repositoryyum list | grep mysql oryum -y list mysql*
install mysq
- Scramble String
hcx2013
String
Given a string s1, we may represent it as a binary tree by partitioning it to two non-empty substrings recursively.
Below is one possible representation of s1 = "great":
- 跟我学Shiro目录贴
jinnianshilongnian
跟我学shiro
历经三个月左右时间,《跟我学Shiro》系列教程已经完结,暂时没有需要补充的内容,因此生成PDF版供大家下载。最近项目比较紧,没有时间解答一些疑问,暂时无法回复一些问题,很抱歉,不过可以加群(334194438/348194195)一起讨论问题。
----广告-----------------------------------------------------
- nginx日志切割并使用flume-ng收集日志
liyonghui160com
nginx的日志文件没有rotate功能。如果你不处理,日志文件将变得越来越大,还好我们可以写一个nginx日志切割脚本来自动切割日志文件。第一步就是重命名日志文件,不用担心重命名后nginx找不到日志文件而丢失日志。在你未重新打开原名字的日志文件前,nginx还是会向你重命名的文件写日志,linux是靠文件描述符而不是文件名定位文件。第二步向nginx主
- Oracle死锁解决方法
pda158
oracle
select p.spid,c.object_name,b.session_id,b.oracle_username,b.os_user_name from v$process p,v$session a, v$locked_object b,all_objects c where p.addr=a.paddr and a.process=b.process and c.object_id=b.
- java之List排序
shiguanghui
list排序
在Java Collection Framework中定义的List实现有Vector,ArrayList和LinkedList。这些集合提供了对对象组的索引访问。他们提供了元素的添加与删除支持。然而,它们并没有内置的元素排序支持。 你能够使用java.util.Collections类中的sort()方法对List元素进行排序。你既可以给方法传递
- servlet单例多线程
utopialxw
单例多线程servlet
转自http://www.cnblogs.com/yjhrem/articles/3160864.html
和 http://blog.chinaunix.net/uid-7374279-id-3687149.html
Servlet 单例多线程
Servlet如何处理多个请求访问?Servlet容器默认是采用单实例多线程的方式处理多个请求的:1.当web服务器启动的