SpringBoot学习笔记【part17】集成Echarts统计图表
一、Echarts 简介
ECharts 是用于图表展示,提供了常规的折线图、柱状图、散点图、饼图、K线图,用于统计的盒形图,用于地理数据可视化的地图、热力图、线图,用于关系数据可视化的关系图、treemap、旭日图,多维数据可视化的平行坐标,还有用于 BI 的漏斗图,仪表盘,并且支持图与图之间的混搭。
官方网站:https://echarts.apache.org/zh/index.html
二、Echarts快速入门
第一步,新建一个 html 文件,引入官网下载的 echarts.min.js 。
<script src="echarts.min.js">script>
第二步,为ECharts准备一个具备大小(宽高)的Dom 。
<div id="main" style="width: 1200px;height:800px;"></div>
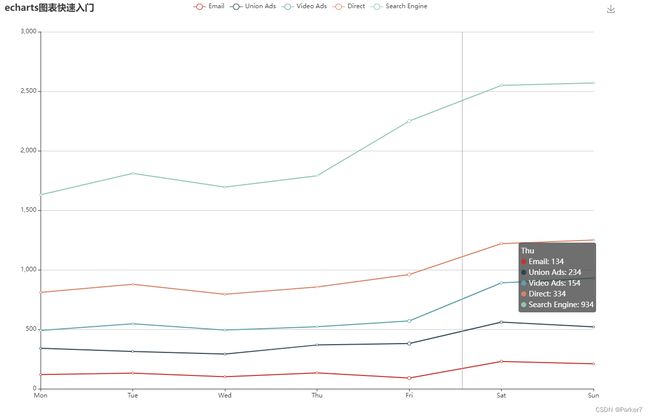
第三步,编写 javascript 渲染图表,以折线图为例。其中关键步骤为首尾两步,echarts.init 方法创建图表对象 、 mychart.setOption 方法配置图表参数。
<script>
  //1.基于准备好的dom,初始化echarts实例
  var myChart = echarts.init(document.getElementById('main'))
  //2.从官网复制下来符合自己场景的图表配置项,并配置其数据
  option = {
    title: {
      text: 'echarts图表快速入门'
    },
    tooltip: {
      trigger: 'axis'
    },
    legend: {
      data: ['Email', 'Union Ads', 'Video Ads', 'Direct', 'Search Engine']
    },
    grid: {
      left: '3%',
      right: '4%',
      bottom: '3%',
      containLabel: true
    },
    toolbox: {
      feature: {
        saveAsImage: {}
      }
    },
    xAxis: {
      type: 'category',
      boundaryGap: false,
      data: ['Mon', 'Tue', 'Wed', 'Thu', 'Fri', 'Sat', 'Sun']
    },
    yAxis: {
      type: 'value'
    },
    series: [
      {
        name: 'Email',
        type: 'line',
        stack: 'Total',
        data: [120, 132, 101, 134, 90, 230, 210]
      },
      {
        name: 'Union Ads',
        type: 'line',
        stack: 'Total',
        data: [220, 182, 191, 234, 290, 330, 310]
      },
      {
        name: 'Video Ads',
        type: 'line',
        stack: 'Total',
        data: [150, 232, 201, 154, 190, 330, 410]
      },
      {
        name: 'Direct',
        type: 'line',
        stack: 'Total',
        data: [320, 332, 301, 334, 390, 330, 320]
      },
      {
        name: 'Search Engine',
        type: 'line',
        stack: 'Total',
        data: [820, 932, 901, 934, 1290, 1330, 1320]
      }
    ]
  };
  //3.填充表参数
  myChart.setOption(option)
script>
第四步,open with live server (运行html)进行测试。
完整html代码结构如下:
DOCTYPE html>
<html lang="en">
<head>
  <meta charset="UTF-8">
  <meta http-equiv="X-UA-Compatible" content="IE=edge">
  <meta name="viewport" content="width=device-width, initial-scale=1.0">
  <title>Documenttitle>
head>
<body>

  <div id="main" style="width: 1200px;height:800px;">div>

body>
<script src="echarts.min.js">script>
<script>
  //1.基于准备好的dom,初始化echarts实例
  var myChart = echarts.init(document.getElementById('main'))
  //2.从官网复制下来符合自己场景的图表配置项,并配置其数据
  option = {
    title: {
      text: 'echarts图表快速入门'
    },
    tooltip: {
      trigger: 'axis'
    },
    legend: {
      data: ['Email', 'Union Ads', 'Video Ads', 'Direct', 'Search Engine']
    },
    grid: {
      left: '3%',
      right: '4%',
      bottom: '3%',
      containLabel: true
    },
    toolbox: {
      feature: {
        saveAsImage: {}
      }
    },
    xAxis: {
      type: 'category',
      boundaryGap: false,
      data: ['Mon', 'Tue', 'Wed', 'Thu', 'Fri', 'Sat', 'Sun']
    },
    yAxis: {
      type: 'value'
    },
    series: [
      {
        name: 'Email',
        type: 'line',
        stack: 'Total',
        data: [120, 132, 101, 134, 90, 230, 210]
      },
      {
        name: 'Union Ads',
        type: 'line',
        stack: 'Total',
        data: [220, 182, 191, 234, 290, 330, 310]
      },
      {
        name: 'Video Ads',
        type: 'line',
        stack: 'Total',
        data: [150, 232, 201, 154, 190, 330, 410]
      },
      {
        name: 'Direct',
        type: 'line',
        stack: 'Total',
        data: [320, 332, 301, 334, 390, 330, 320]
      },
      {
        name: 'Search Engine',
        type: 'line',
        stack: 'Total',
        data: [820, 932, 901, 934, 1290, 1330, 1320]
      }
    ]
  };
  //3.填充表参数
  myChart.setOption(option)
script>

html>
三、SpringBoot中集成Echarts
第一步,执行 npm install --save echarts 在项目中下载 Echarts 的相关依赖。
第二步,编写请求后端接口的 js 接口代码:
  //获取统计图表测试数据
  getCountMap() {
    return request({
        url: `/admin/statistics/testCountMap`,
        method: 'get',
    })
}
第三步,配置 router 路由后添加新的组件testChart.vue:
<template>
  <div class="app-container">


    <div class="chart-container">
        <div id="chart" ref="chart"
            class="chart" style="height:500px;width:100%"/>
    div>

  div>
template>
第四步,编写 javascript ,引入 echarts 包以及后端接口,调用后端请求图表数据。
<script>
import echarts from 'echarts'
import statisticsApi from '@/api/statistics'
export default {
data() {
return {
chart: null,
title: '',
xData: [], // x轴数据
yData: [] // y轴数据
}
},
created () {
this.showChart()
},
methods: {
//1.初始化图表数据
showChart() {
statisticsApi.testCountMap()
.then(response => {
this.xData = response.data.xData
this.yData = response.data.yData
this.setChartData()
})
},
//2.设置图表数据
setChartData() {
//2.1基于准备好的dom,初始化echarts实例
var myChart = echarts.init(document.getElementById('chart'))
//2.2指定图表的配置项和数据
var option = {
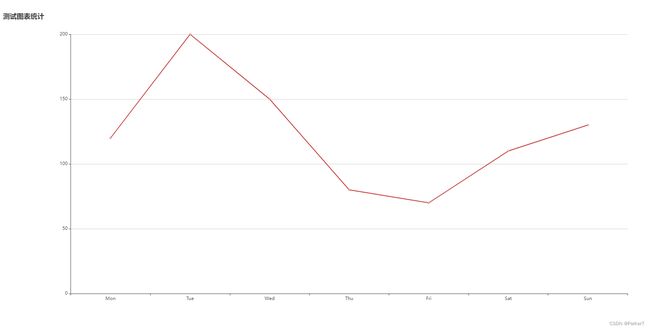
title: {
text: this.title + '测试图表统计'
},
legend: {
data: [this.title]
},
xAxis: {
data: this.xData
},
yAxis: {
minInterval: 1
},
series: [{
name: this.title,
type: 'line',
data: this.yData,
showBackground: true,
backgroundStyle: {
color: 'rgba(180, 180, 180, 0.2)'
}
}]
}
//2.3使用刚指定的配置项和数据显示图表
myChart.setOption(option)
},
}
}
script>
第五步,编写后端接口,直接使用测试数据。
@RestController
@RequestMapping("/admin/statistics")
public class StatisticsController {

    @GetMapping("testCountMap")
    public Result testCountMap(){
        List<String> xList = Arrays.asList("Mon", "Tue", "Wed", "Thu", "Fri", "Sat", "Sun");
        List<Integer> yList = Arrays.asList(120, 200, 150, 80, 70, 110, 130);
        Map<String ,Object> map = new HashMap<>();
        map.put("xData",xList);
        map.put("yData",yList);
        return Result.ok(map);
    }

}
第六步,启动服务器测试。