pd.plot.bar()绘制多维柱状图以及图例、网格线、数字标注的设置
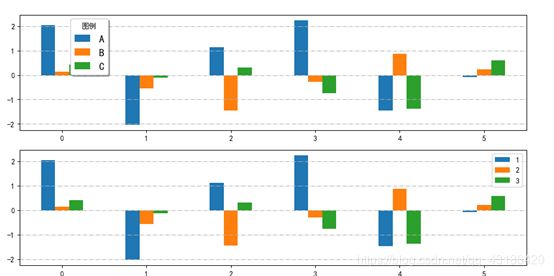
对pd.DataFarme利用pd.plot.bar()绘制多维柱状图:
数据结构(要求数据是pd.DataFrame 或者 pd.series)
data = pd.DataFrame(np.random.randn(6,3),columns=['A','B','C'])
fig = plt.figure(figsize = (10, 5), dpi = 90) # 声明画布1
ax1 = fig.add_subplot(2,1,1)
data.plot.bar(ax=ax1,rot=0 )
plt.tight_layout()
plt.grid(linestyle='-.', axis='y')
plt.legend(shadow=True, loc=(0.1, 0.48), title='图例', handlelength=1.5, fontsize=14)
ax2 = fig.add_subplot(2,1,2)
data.plot.bar(ax=ax2,rot=0 )
#plt.tight_layout()
plt.grid(linestyle='-.', axis='y')
plt.legend(labels=['1','2','3'],loc='best')
结果:
注1:网格线的介绍。
plt.grid(linestyle=’-.’, axis=‘y’)
官方文档:https://matplotlib.org/api/_as_gen/matplotlib.pyplot.grid.html
plt.grid(b, which, axis, color, linestyle, linewidth, **kwargs)
常用的参数:
axis : {‘both’, ‘x’, ‘y’}, optional.想绘制某一方向的网格线。
color :设置网格线的颜色。有时候用c来代替color。
linestyle : 设置网格线的风格,有时用ls来代替linestyle,{’-’, ‘–’, ‘-.’, ‘:’, ‘’, (offset, on-off-seq), …}
linewidth : 设置网格线的宽度
注2:plt.tight_layout()
tight_layout会自动调整子图参数,使之填充整个图像区域。这是个实验特性,可能在一些情况下不工作。它仅仅检查坐标轴标签、刻度标签以及标题的部分
参考:https://www.jianshu.com/p/91eb0d616adb
Matplotlib 中文用户指南 3.4 密致布局指南
注3:plt.lengend() 指定图例的位置
参考:https://www.jianshu.com/p/20b44e50cbce
官方文档:https://matplotlib.org/api/_as_gen/matplotlib.pyplot.legend.html
常用:
plt.legend(handles, labels, loc): handles是指要处理的数据线段,labels指线段的标签,loc设置图例的位置
plt.legend(shadow=True, loc=(0.01, 0.48), title=‘图例’, handlelength=3, fontsize=14)
shadow:控制是否在图例后面绘制阴影
loc : The location can also be a 2-tuple giving the coordinates of the lower-left corner of the legend in axes coordinates (in which case bbox_to_anchor will be ignored).(这里指的是距离坐标轴的位置)
Handlelength: The length of the legend handles.
注4 :pd. plot.bar(x,y, **kwds)
x,y ;指定绘制的x轴与y轴的数据。不指定时,全部绘制
rot: x轴标签的旋转角度,0-360
subplots: True, False 是否分开绘制
legend: Ture 是否设置图列
