【备忘】python绘制地图实例
目录
- 例一:使用cartopy内置底图,绘制流域范围
- 例二:调用天地图作为底图,绘制流域范围
- 例三:绘制欧洲各国位置
作为python绘制地图的备忘录
python调用在线地图api教程
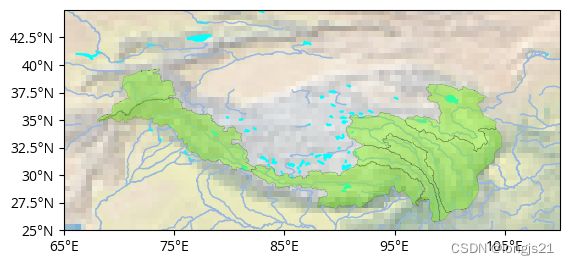
例一:使用cartopy内置底图,绘制流域范围
思路:
- 建立画布
- 确定参数,如投影,显示范围,分辨率等
- 添加底图,这里采用内置低分辨率底图
.stock_img() - 添加其他要素,如河、湖等,并调整显示参数
- 添加经纬度等其他信息
import matplotlib.pyplot as plt
import cartopy.crs as ccrs
import cartopy.feature as cfeature
from cartopy.mpl.ticker import LongitudeFormatter, LatitudeFormatter

fig = plt.figure()
proj = ccrs.PlateCarree(central_longitude=0)
extents = [65, 110, 25, 45]
res = '10m'

ax = fig.add_subplot(111, projection=proj)
ax.set_extent(extents, crs=proj)

# 添加地形图
ax.stock_img()

# 添加河湖
ax.add_feature(cfeature.LAKES.with_scale(res), edgecolor=None,color='cyan')
ax.add_feature(cfeature.RIVERS.with_scale(res),lw=1)

for ea in tp.iloc[[0,1,3,5,7,8,9]]['geometry']:
    feat = cartopy.feature.ShapelyFeature([ea], proj, facecolor='chartreuse', edgecolor='black', lw=0.2,alpha=0.4)
    ax.add_feature(feat)


path = '/group1/longjs/TP_shape/Union/'
tp = gpd.read_file(path+'TP_basins.shp')  # 本地shape文件,为流域边界

# 添加经纬度
ax.set_xticks(np.arange(65, 110, 10), crs=proj)
ax.set_yticks(np.arange(25, 45, 2.5), crs=proj)
ax.xaxis.set_major_formatter(LongitudeFormatter())
ax.yaxis.set_major_formatter(LatitudeFormatter())

plt.show();
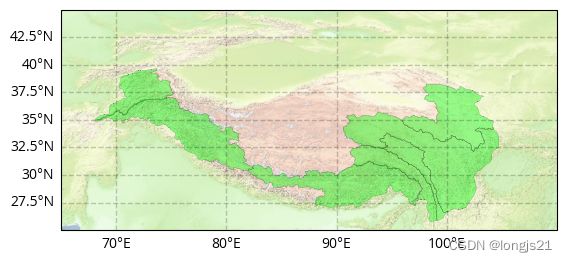
例二:调用天地图作为底图,绘制流域范围
思路:
- 难点在于调用API,网站提供了多个接口,可根据需要调用
- 相较内置的底图,该方法能够得到更清晰的底图
- 后续可考虑调用如谷歌、高德等接口
import matplotlib.pyplot as plt
import geopandas as gpd
import cartopy.crs as ccrs
from cartopy.mpl.gridliner import LONGITUDE_FORMATTER, LATITUDE_FORMATTER
import cartopy.io.img_tiles as cimgt

# 定义画布
fig = plt.figure()
proj = ccrs.PlateCarree(central_longitude=0)
extents = [65, 110, 25, 45]
ax = fig.add_subplot(111, projection=proj)
ax.set_extent(extents, crs=proj)

# 调用地图
ax.add_image(cimgt.MAP_ter_w(),5)   # 数字为地图分层

path = '/group1/longjs/TP_shape/Union/'
tp = gpd.read_file(path+'TP_basins.shp')  # 本地shape文件,为流域边界

# 依次绘制不同流域
for ea in tp.iloc[[0,1,3,5,7,8,9]]['geometry']:
    feat = cartopy.feature.ShapelyFeature([ea], proj, facecolor="lime", edgecolor='black', lw=0.2,alpha=0.4)
    ax.add_feature(feat)

# 添加细节
lon_lat = ax.gridlines(draw_labels=True, linewidth=1, color='k', alpha=0.2, linestyle='--')
lon_lat.xlabels_top = False
lon_lat.ylabels_right = False
lon_lat.xformatter = LONGITUDE_FORMATTER
lon_lat.yformatter = LATITUDE_FORMATTER

plt.show();
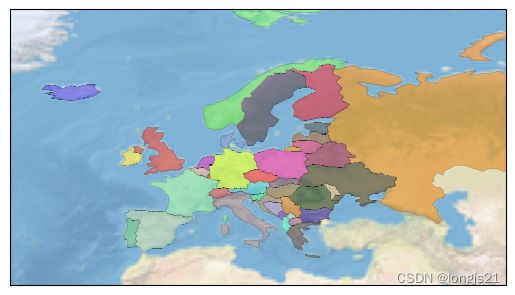
例三:绘制欧洲各国位置
思路:
- 内置的国界里,中国的版图并不全,后续需要调用在线网站的边界,或其他途径下载
- 根据不同国家赋予不同颜色,以示区分
- 叠加地形底图,让画面更美观
- 根据需要添加海岸线
import cartopy
import cartopy.crs as ccrs
from cartopy.feature import ShapelyFeature
from matplotlib import pyplot as plt
import geopandas as gpd
import cartopy.io.img_tiles as cimgt

# 定义画布
fig = plt.figure()
proj = ccrs.PlateCarree(central_longitude=0)
extents = [-30, 60, 30, 80]
ax = fig.add_subplot(111, projection=proj)
ax.set_extent(extents, crs=proj)

# 添加底图
ax.stock_img()

# 添加数据
world = gpd.read_file(gpd.datasets.get_path('naturalearth_lowres'))
europe = world[(world['continent'] == 'Europe')]

# 依次画出欧洲不同国家边界,并给予不同颜色。需要注意,中国的边界不完整!
for ea in europe['geometry']:
    color = ["#"+''.join([random.choice('0123456789ABCDEF') for j in range(6)])]
    feat = cartopy.feature.ShapelyFeature([ea], proj, facecolor=color,edgecolor='black', lw=0.2,alpha=0.5)
    ax.add_feature(feat)

# ax.add_image(cimgt.MAP_cva_w(),6)
# 添加海岸线
# ax.add_feature(cartopy.feature.COASTLINE)

plt.show();


