【Matlab】智能优化算法_蚁群优化算法ACO
【Matlab】智能优化算法_蚁群优化算法ACO
- 1.背景介绍
- 2.废话不多说,直接上代码
- 3.文件结构
- 4.详细代码及注释
-
- 4.1 ACO.m
- 4.2 createColony.m
- 4.3 createGraph.m
- 4.4 drawBestTour.m
- 4.5 drawGraph.m
- 4.6 drawPhromone.m
- 4.7 ACO.mfitnessFunction.m
- 4.8 rouletteWheel.m
- 4.9 updatePhromone.m
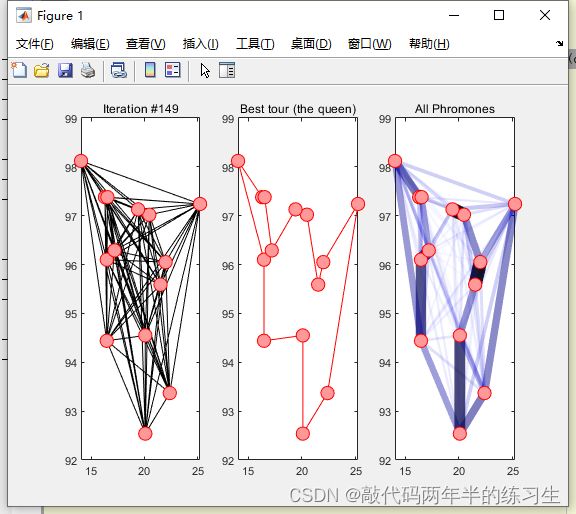
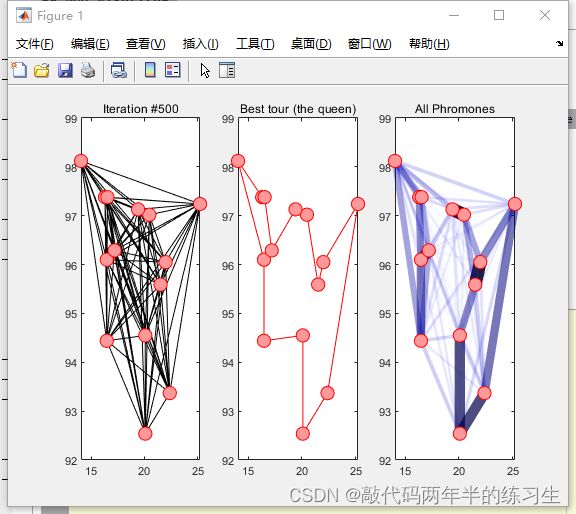
- 5.运行结果
- 6.参考文献
1.背景介绍
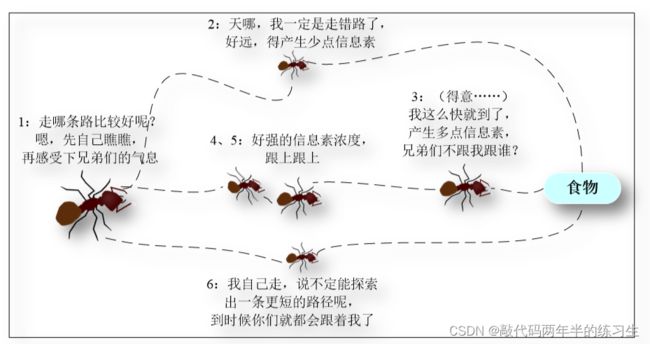
自然界的蚁群在寻找食物的过程中,通过一种叫费洛蒙的物质,实现了相互的间接通信,协同寻找从蚁巢到食物源的最短路径。
通过对这些群体的智能行为进行抽象建模,研究者提出了蚁群优化(ant colony optimization, aco),为解决优化问题,特别是组合优化问题提供了强有力的方法。
蚂蚁通常是随机选择道路来寻找食物,但它们会感知地面上的信息素浓度,并倾向于向信息素浓度高的方向移动。费洛蒙是蚂蚁自己放出的,实现蚁群内间接通信的物质。短路径上的蚂蚁往返时间较短,单位时间内经过这条路径的蚂蚁较多,因此费洛蒙的积累速度比长路径快。因此,跟随的蚂蚁在交叉路口时,会感知先走的蚂蚁留下的信息,选择较短的路前进。这个积极的反馈使更多的蚂蚁沿着房子和食物之间最短的路径移动。由于其他道路上的费洛蒙会随着时间的推移蒸发,所有的蚂蚁最终都会走上最佳的道路。
2.废话不多说,直接上代码
3.文件结构
ACO.m							% 蚁群优化算法
createColony.m					% 初始化领地
createGraph.m					% 初始化图
drawBestTour.m					% 绘制最佳路线
drawGraph.m						% 绘制图形
drawPhromone.m					% 绘制Phromone
fitnessFunction.m				% 适应度函数
rouletteWheel.m					% 轮盘规则
updatePhromone.m				% 更新Phromone
4.详细代码及注释
4.1 ACO.m
clear all
close all
clc

%% Problem preparation

% Create the graph
[ graph ]  = createGraph();

% Draw the graph
figure

subplot(1,3,1)
drawGraph( graph);


%% ACO algorithm

%% Initial parameters of ACO
maxIter = 500;
antNo = 50;

tau0 = 10 * 1 / (  graph.n * mean( graph.edges(:)  )  );  % Initial phromone concentration

tau = tau0 * ones( graph.n , graph.n); % Phromone matirx
eta = 1./ graph.edges;  % desirability of each edge

rho = 0.5; % Evaporation rate
alpha = 1;  % Phromone exponential parameters
beta = 1;  % Desirability exponetial paramter


%% Main loop of ACO

bestFitness = inf;
bestTour = [];
for t = 1 : maxIter
    % Create Ants

    colony = [];
    colony = createColony( graph, colony , antNo, tau, eta, alpha,  beta);


    % Calculate the fitness values of all ants
    for i = 1 : antNo
        colony.ant(i).fitness = fitnessFunction(colony.ant(i).tour , graph );
    end

    % Find the best ant (queen)
    allAntsFitness = [ colony.ant(:).fitness ];
    [ minVal , minIndex ] = min( allAntsFitness );
    if minVal < bestFitness
        bestFitness = colony.ant(minIndex).fitness;
        bestTour = colony.ant(minIndex).tour;
    end

    colony.queen.tour = bestTour;
    colony.queen.fitness = bestFitness;

    % Update phromone matrix
    tau = updatePhromone( tau , colony );

    % Evaporation
    tau  = ( 1 - rho ) .* tau;

    % Display the results

    outmsg = [ 'Iteration #' , num2str(t) , ' Shortest length = ' , num2str(colony.queen.fitness)  ];
    disp(outmsg)
    subplot(1,3,1)
    title(['Iteration #' , num2str(t) ])
    % Visualize best tour and phromone concentration
    subplot(1,3,2)
    cla
    drawBestTour( colony, graph );


    subplot(1,3,3)
    cla
    drawPhromone( tau , graph );

   drawnow
end
4.2 createColony.m
function [ colony ] = createColony( graph, colony , antNo, tau, eta, alpha,  beta)

nodeNo = graph.n;

for i = 1 : antNo

    initial_node = randi( [1 , nodeNo] ); % select a random node
    colony.ant(i).tour(1) = initial_node;

    for j = 2 : nodeNo % to choose the rest of nodes
               currentNode =  colony.ant(i).tour(end);

               P_allNodes = tau( currentNode , :  ) .^ alpha .* eta( currentNode , :  )  .^ beta;
               P_allNodes(colony.ant(i).tour) = 0 ;  % assing 0 to all the nodes visited so far
               P = P_allNodes ./ sum(P_allNodes);

               nextNode = rouletteWheel(P);
               colony.ant(i).tour = [  colony.ant(i).tour , nextNode ];
    end

    % complete the tour
    colony.ant(i).tour = [ colony.ant(i).tour , colony.ant(i).tour(1)];
end

end
4.3 createGraph.m
function [ graph ]  = createGraph()
% To create the graph and calculate the distances between each nodes
% x = [ 0.09 , 0.16 , 0.84 , 0.70 ];
% y = [0.17,   0.52,  0.92, 0.16];
%

% 14 nodes
x = [16.47000,16.47000,20.09000,22.39000,25.23000,22,20.47000,17.20000,16.30000,14.05000,16.53000,21.52000,19.41000,20.09000];
 y = [96.10000,94.44000,92.54000,93.37000,97.24000,96.05000,97.02000,96.29000,97.38000,98.12000,97.38000,95.59000,97.13000,94.55000]


%     % 50 nodes
%   nodes = [7,9,2,0,0,1,7,1,2,51,42,31,5,12,36,52,27,17,13,57,62,42,16,8,7,27,30,43,58,58,37,38,46,61,62,63,32,45,59,5,10,21,5,30,39,32,25,25,48,56;52,49,64,26,30,47,63,62,33,21,41,32,25,42,16,41,23,33,13,58,42,57,57,52,38,68,48,67,48,27,69,46,10,33,63,69,22,35,15,6,17,10,64,15,10,39,32,55,28,37]
%   x = nodes(1,:);
%   y = nodes(2,:);

%  % 100 nodes
%
%  nodes = [1380,2848,3510,457,3888,984,2721,1286,2716,738,1251,2728,3815,3683,1247,123,1234,252,611,2576,928,53,1807,274,2574,178,2678,1795,3384,3520,1256,1424,3913,3085,2573,463,3875,298,3479,2542,3955,1323,3447,2936,1621,3373,1393,3874,938,3022,2482,3854,376,2519,2945,953,2628,2097,890,2139,2421,2290,1115,2588,327,241,1917,2991,2573,19,3911,872,2863,929,839,3893,2178,3822,378,1178,2599,3416,2961,611,3113,2597,2586,161,1429,742,1625,1187,1787,22,3640,3756,776,1724,198,3950;939,96,1671,334,666,965,1482,525,1432,1325,1832,1698,169,1533,1945,862,1946,1240,673,1676,1700,857,1711,1420,946,24,1825,962,1498,1079,61,1728,192,1528,1969,1670,598,1513,821,236,1743,280,1830,337,1830,1646,1368,1318,955,474,1183,923,825,135,1622,268,1479,981,1846,1806,1007,1810,1052,302,265,341,687,792,599,674,1673,1559,558,1766,620,102,1619,899,1048,100,901,143,1605,1384,885,1830,1286,906,134,1025,1651,706,1009,987,43,882,392,1642,1810,1558]
%  x = nodes(1,:);
%   y = nodes(2,:);


graph.n = length(x);

for i = 1 : graph.n
    graph.node(i).x = x(i);
    graph.node(i).y = y(i);
end

graph.edges = zeros(  graph.n , graph.n );

for i = 1 : graph.n
    for j = 1: graph.n
        x1 = graph.node(i).x ;
        x2 = graph.node(j).x;
        y1 = graph.node(i).y;
        y2 = graph.node(j).y;

        graph.edges(i,j) = sqrt(  (x1 - x2) ^2 + (y1 - y2)^2  );

    end
end


end
4.4 drawBestTour.m
function [ ] = drawBestTour(colony , graph)

queenTour = colony.queen.tour;
hold on
for i = 1 : length(queenTour) - 1

    currentNode = queenTour(i);
    nextNode =  queenTour(i+1);

    x1 = graph.node(currentNode).x;
    y1 = graph.node(currentNode).y;

    x2 = graph.node(nextNode).x;
    y2 = graph.node(nextNode).y;

    X = [x1 , x2];
    Y = [y1, y2];
    plot (X, Y, '-r');

end


for i = 1 : graph.n

    X = [graph.node(:).x];
    Y = [graph.node(:).y];

    plot(X, Y, 'ok', 'markerSize' , 10 , 'MarkerEdgeColor' , 'r' , 'MarkerFaceColor', [1, 0.6, 0.6]);
end

title('Best tour (the queen)')
box('on');
4.5 drawGraph.m
function [   ]  = drawGraph( graph )
% To visualize the nodes and edges of the graph
hold on

for i = 1 : graph.n - 1
    for j =  i+1 : graph.n

        x1 = graph.node(i).x;
        y1 = graph.node(i).y;

        x2 = graph.node(j).x;
        y2 = graph.node(j).y;

        X = [x1 , x2];
        Y = [y1 , y2];

        plot( X , Y , '-k');
    end
end

for i = 1 : graph.n
    X = [graph.node(:).x];
    Y = [graph.node(:).y ];
    plot(X,Y, 'ok', 'MarkerSize', 10, 'MarkerEdgeColor' , 'r' , 'MarkerFaceColor' , [ 1, 0.6 , 0.6]);
end

title ('Al nodes and edges')
box('on')

end
4.6 drawPhromone.m
function [ ] = drawPhromone(tau , graph)

maxTau = max(tau(:));
minTau = min(tau(:));

tau_normalized = (tau - minTau) ./ (maxTau - minTau);

for i = 1 : graph.n -1
    for j = i+1 : graph.n
        x1 = graph.node(i).x;
        y1 = graph.node(i).y;

        x2 = graph.node(j).x;
        y2 = graph.node(j).y;

        X = [x1 , x2];
        Y = [y1 , y2];

         tau(i , j);

        plot(X,Y, 'color' , [0, 0, (1-tau_normalized(i,j)),  tau_normalized(i,j)] , 'lineWidth', 10.*tau_normalized(i,j) + 1)

    end
end

for i = 1 : graph.n
    hold on
    X = [graph.node(:).x];
    Y = [graph.node(:).y];
    plot(X , Y , 'ok',  'MarkerSize', 10, 'MarkerEdgeColor', 'r', 'MarkerFaceColor', [1 .6 .6])
end


title('All Phromones')
box on

end
4.7 ACO.mfitnessFunction.m
function [ fitness ] = fitnessFunction ( tour , graph)


fitness = 0;

for i = 1 : length(tour) -1

    currentNode = tour(i);
    nextNode = tour(i+1);

    fitness = fitness + graph.edges( currentNode ,  nextNode );

end


end
4.8 rouletteWheel.m
function [ nextNode ] = rouletteWheel( P )
% Roulette wheel to choose one edge based on P values
cumsumP = cumsum(P);

r = rand();

nextNode = find( r <= cumsumP );

nextNode = nextNode(1);


end
4.9 updatePhromone.m
function [ tau ] = updatePhromone(tau , colony)
% Update the phromone matrix.
nodeNo = length (colony.ant(1).tour);
antNo = length( colony.ant(:) );

for i = 1 : antNo % for each ant
    for j = 1 : nodeNo-1 % for each node in the tour
        currentNode = colony.ant(i).tour(j);
        nextNode = colony.ant(i).tour(j+1);

        tau(currentNode , nextNode) = tau(currentNode , nextNode)  + 1./ colony.ant(i).fitness;
        tau(nextNode , currentNode) = tau(nextNode , currentNode)  + 1./ colony.ant(i).fitness;

    end
end

end
5.运行结果
6.参考文献
[1]M D,V M,A C. Ant system: optimization by a colony of cooperating agents.[J]. IEEE transactions on systems, man, and cybernetics. Part B, Cybernetics : a publication of the IEEE Systems, Man, and Cybernetics Society,1996,26(1).


