Python爬虫+数据可视化:分析唯品会商品数据
目录
- 前言
- 数据来源分析
-
-
- 1. 明确需求
- 2. 抓包分析:通过浏览器自带工具: 开发者工具
-
- 代码实现步骤: 发送请求 -> 获取数据 -> 解析数据 -> 保存数据
-
-
- 发送请求
- 解析数据
- 保存数据
-
- 数据可视化
-
-
- 先读取数据
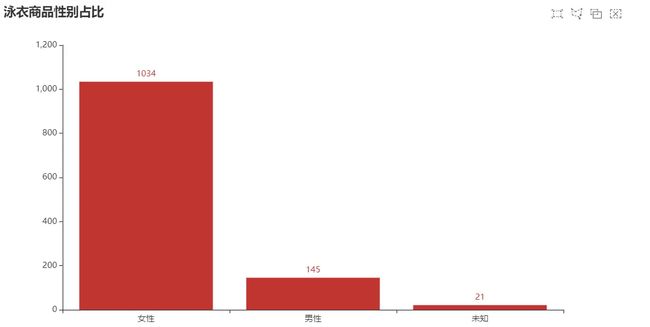
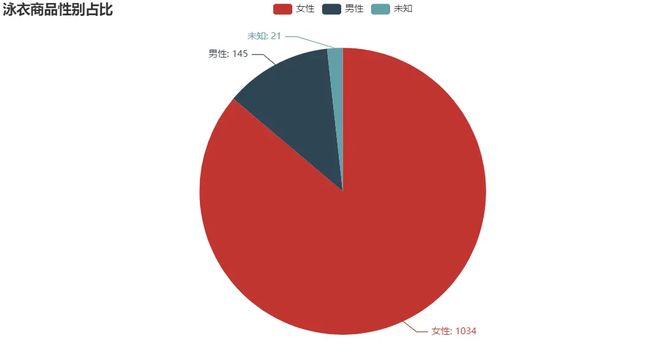
- 泳衣商品性别占比
- 商品品牌分布占比
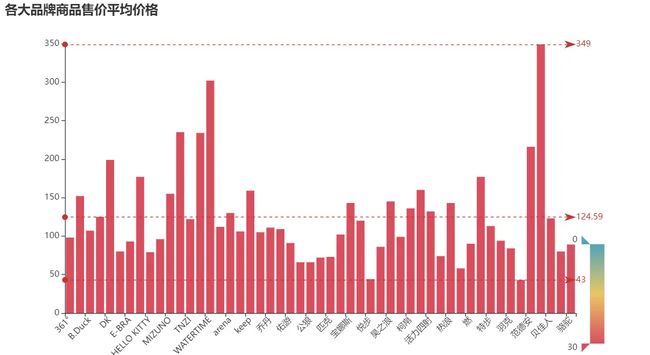
- 各大品牌商品售价平均价格
- 各大品牌商品原价平均价格
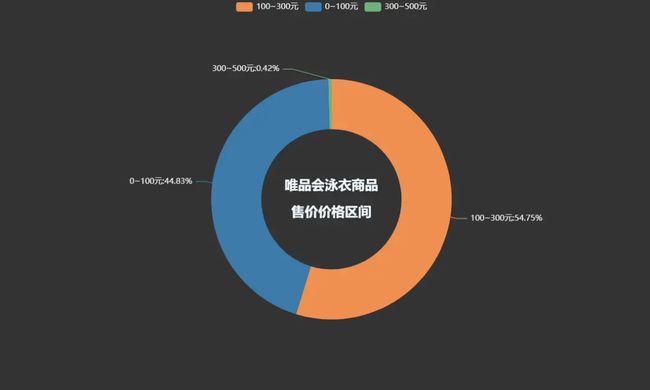
- 唯品会泳衣商品售价价格区间
-
前言
唯品会是中国领先的在线特卖会电商平台之一,它以“品牌特卖会”的模式运营,为会员提供品牌折扣商品。唯品会的商品包括服装、鞋类、箱包、美妆、家居、母婴、食品等各类品牌产品。
这就是今天的受害者,我们要拿取上面的泳衣数据,然后可以做些数据可视化
数据来源分析
1. 明确需求
- 明确采集网站以及数据
网址: https://category.vip.com/suggest.php?keyword=%E6%B3%B3%E8%A1%A3&ff=235|12|1|1
数据: 商品信息
2. 抓包分析:通过浏览器自带工具: 开发者工具
- 打开开发者工具: F12 / 右键点击检查选择network
- 刷新网页: 让网页数据重新加载一遍
- 搜索关键字: 搜索数据在哪里
找到数据包: 50条商品数据信息
整页数据内容: 120条 --> 分成三个数据包
1. 前50条数据 --> 前50个商品ID
2. 中50条数据 --> 中50个商品ID
3. 后20条数据 --> 后20个商品ID
已知: 数据分为三组 --> 对比三组数据包请求参数变化规律
请求参数变化规律: 商品ID
分析找一下 是否存在一个数据包, 包含所有商品ID
如果想要获取商品信息 --> 先获取所有商品ID --> ID存在数据包
代码实现步骤: 发送请求 -> 获取数据 -> 解析数据 -> 保存数据
发送请求
我们定义了要爬取的URL地址,并设置了User-Agent请求头,以模拟浏览器发送请求。
使用requests.get方法发送GET请求,并将响应保存在response变量中。
headers = {
    # 防盗链 告诉服务器请求链接地址从哪里跳转过来
    'Referer': 'https://category.vip.com/',
    # 用户代理, 表示浏览器基本身份信息
    'User-Agent': 'Mozilla/5.0 (Windows NT 10.0; Win64; x64) AppleWebKit/537.36 (KHTML, like Gecko)'
}
# 请求链接
url = 'https://mapi.vip.com/vips-mobile/rest/shopping/pc/search/product/rank'
data = {
    # 回调函数
    # 'callback': 'getMerchandiseIds',
    'app_name': 'shop_pc',
    'app_version': '4.0',
    'warehouse': 'VIP_HZ',
    'fdc_area_id': '104103101',
    'client': 'pc',
    'mobile_platform': '1',
    'province_id': '104103',
    'api_key': '70f71280d5d547b2a7bb370a529aeea1',
    'user_id': '',
    'mars_cid': '1689245318776_e2b4a7b51f99b3dd6a4e6d356e364148',
    'wap_consumer': 'a',
    'standby_id': 'nature',
    'keyword': '泳衣',
    'lv3CatIds': '',
    'lv2CatIds': '',
    'lv1CatIds': '',
    'brandStoreSns': '',
    'props': '',
    'priceMin': '',
    'priceMax': '',
    'vipService': '',
    'sort': '0',
    'pageOffset': '0',
    'channelId': '1',
    'gPlatform': 'PC',
    'batchSize': '120',
    '_': '1689250387620',
}
# 发送请求 -->  响应对象
response = requests.get(url=url, params=data, headers=headers)
解析数据
然后,我们定义了起始标签和结束标签,通过循环的方式遍历文本,并提取每个商品的名称和价格。
# 商品ID -> 120个
products = [i['pid'] for i in response.json()['data']['products']]
# 把120个商品ID 分组 --> 切片 起始:0 结束:50 步长:1
# 列表合并成字符串
product_id_1 = ','.join(products[:50]) #  提取前50个商品ID 0-49
product_id_2 = ','.join(products[50:100]) #  提取中50个商品ID 50-99
product_id_3 = ','.join(products[100:]) #  提取后20个商品ID 100到最后
product_id_list = [product_id_1, product_id_2, product_id_3]

for product_id in product_id_list:
    # 请求链接
    link = 'https://mapi.vip.com/vips-mobile/rest/shopping/pc/product/module/list/v2'
    # 请求参数
    params = {
        # 'callback': 'getMerchandiseDroplets2',
        'app_name': 'shop_pc',
        'app_version': '4.0',
        'warehouse': 'VIP_HZ',
        'fdc_area_id': '104103101',
        'client': 'pc',
        'mobile_platform': '1',
        'province_id': '104103',
        'api_key': '70f71280d5d547b2a7bb370a529aeea1',
        'user_id': '',
        'mars_cid': '1689245318776_e2b4a7b51f99b3dd6a4e6d356e364148',
        'wap_consumer': 'a',
        'productIds': product_id,
        'scene': 'search',
        'standby_id': 'nature',
        'extParams': '{"stdSizeVids":"","preheatTipsVer":"3","couponVer":"v2","exclusivePrice":"1","iconSpec":"2x","ic2label":1,"superHot":1,"bigBrand":"1"}',
        'context': '',
        '_': '1689250387628',
    }
    # 发送请求
    json_data = requests.get(url=link, params=params, headers=headers).json()
    for index in json_data['data']['products']:
        # 商品信息
        attr = ','.join([j['value'] for j in index['attrs']])
        # 创建字典
        dit = {
            '标题': index['title'],
            '品牌': index['brandShowName'],
            '原价': index['price']['marketPrice'],
            '售价': index['price']['salePrice'],
            '折扣': index['price']['mixPriceLabel'],
            '商品信息': attr,
            '详情页': f'https://detail.vip.com/detail-{index["brandId"]}-{index["productId"]}.html',
        }
        csv_writer.writerow(dit)
        print(dit)
保存数据
然后,我们使用open函数创建一个CSV文件,并指定文件名、写入模式、编码方式等参数。然后使用csv.DictWriter初始化一个写入器对象,并指定表头。
我们使用writer.writeheader()来写入CSV文件的表头,然后遍历items列表,使用writer.writerow()将每个商品的数据写入CSV文件中。
f = open('商品.csv', mode='a', encoding='utf-8', newline='')
csv_writer = csv.DictWriter(f, fieldnames=[
    '标题',
    '品牌',
    '原价',
    '售价',
    '折扣',
    '商品信息',
    '详情页',
])
csv_writer.writeheader()
数据可视化
先读取数据
df = pd.read_csv('商品.csv')
df.head()
泳衣商品性别占比
from pyecharts import options as opts
from pyecharts.charts import Bar
from pyecharts.faker import Faker


c = (
    Bar()
    .add_xaxis(sex_type)
    .add_yaxis("", sex_num)
    .set_global_opts(
        title_opts=opts.TitleOpts(title="泳衣商品性别占比", subtitle=""),
        brush_opts=opts.BrushOpts(),
    )
)
c.load_javascript()
from pyecharts import options as opts
from pyecharts.charts import Pie

c = (
    Pie()
    .add("", [list(z) for z in zip(sex_type, sex_num)])
    .set_global_opts(title_opts=opts.TitleOpts(title="泳衣商品性别占比"))
    .set_series_opts(label_opts=opts.LabelOpts(formatter="{b}: {c}"))
)
c.render_notebook()
商品品牌分布占比
shop_num = df['品牌'].value_counts().to_list()
shop_type = df['品牌'].value_counts().index.to_list()
c = (
    Pie()
    .add(
        "",
        [
            list(z)
            for z in zip(shop_type, shop_num)
        ],
        center=["40%", "50%"],
    )
    .set_global_opts(
        title_opts=opts.TitleOpts(title="商品品牌分布占比"),
        legend_opts=opts.LegendOpts(type_="scroll", pos_left="80%", orient="vertical"),
    )
    .set_series_opts(label_opts=opts.LabelOpts(formatter="{b}: {c}"))
)
c.render_notebook()
各大品牌商品售价平均价格
# 按城市分组并计算平均薪资
avg_salary = df.groupby('品牌')['售价'].mean()
ShopType = avg_salary.index.tolist()
ShopNum = [int(a) for a in avg_salary.values.tolist()]
# 创建柱状图实例
c = (
    Bar()
    .add_xaxis(ShopType)
    .add_yaxis("", ShopNum)
    .set_global_opts(
        title_opts=opts.TitleOpts(title="各大品牌商品售价平均价格"),
        visualmap_opts=opts.VisualMapOpts(
            dimension=1,
            pos_right="5%",
            max_=30,
            is_inverse=True,
        ),
        xaxis_opts=opts.AxisOpts(axislabel_opts=opts.LabelOpts(rotate=45))  # 设置X轴标签旋转角度为45度
    )
    .set_series_opts(
        label_opts=opts.LabelOpts(is_show=False),
        markline_opts=opts.MarkLineOpts(
            data=[
                opts.MarkLineItem(type_="min", name="最小值"),
                opts.MarkLineItem(type_="max", name="最大值"),
                opts.MarkLineItem(type_="average", name="平均值"),
            ]
        ),
    )
)

c.render_notebook()
各大品牌商品原价平均价格
# 按城市分组并计算平均薪资
avg_salary = df.groupby('品牌')['原价'].mean()
ShopType_1 = avg_salary.index.tolist()
ShopNum_1 = [int(a) for a in avg_salary.values.tolist()]
# 创建柱状图实例
c = (
    Bar()
    .add_xaxis(ShopType_1)
    .add_yaxis("", ShopNum_1)
    .set_global_opts(
        title_opts=opts.TitleOpts(title="各大品牌商品原价平均价格"),
        visualmap_opts=opts.VisualMapOpts(
            dimension=1,
            pos_right="5%",
            max_=30,
            is_inverse=True,
        ),
        xaxis_opts=opts.AxisOpts(axislabel_opts=opts.LabelOpts(rotate=45))  # 设置X轴标签旋转角度为45度
    )
    .set_series_opts(
        label_opts=opts.LabelOpts(is_show=False),
        markline_opts=opts.MarkLineOpts(
            data=[
                opts.MarkLineItem(type_="min", name="最小值"),
                opts.MarkLineItem(type_="max", name="最大值"),
                opts.MarkLineItem(type_="average", name="平均值"),
            ]
        ),
    )
)

c.render_notebook()
唯品会泳衣商品售价价格区间
pie1 = (
    Pie(init_opts=opts.InitOpts(theme='dark',width='1000px',height='600px'))

    .add('', datas_pair_2, radius=['35%', '60%'])
    .set_series_opts(label_opts=opts.LabelOpts(formatter="{b}:{d}%"))
    .set_global_opts(
        title_opts=opts.TitleOpts(
            title="唯品会泳衣商品\n\n售价价格区间",
            pos_left='center',
            pos_top='center',
            title_textstyle_opts=opts.TextStyleOpts(
                color='#F0F8FF',
                font_size=20,
                font_weight='bold'
            ),
        )
    )
    .set_colors(['#EF9050', '#3B7BA9', '#6FB27C', '#FFAF34', '#D8BFD8', '#00BFFF', '#7FFFAA'])
)
pie1.render_notebook()


