echarts修改鼠标悬浮样式和默认高亮效果,和传值高亮修改字体模糊
具体的上代码
var myChartzuoixia = echarts.init(document.querySelector(''));
$("#tableEcharts").removeAttr("_echarts_instance_").empty();
let option = {
tooltip: {
trigger: 'axis',
axisPointer: {
// type: 'cross',
crossStyle: {
color: '#999'
}
},
textStyle: {
fontSize: document.body.clientWidth > 2800 ? 23 : 14
},
formatter: function (params) {
// return console.log(params);
let circle = ``;
// let data0 = `${circle}params[0].color">`;
let aa=params[0].color
// return `${params[0].axisValueLabel}
${data0}
${data1}`;
return `${params[0]. axisValueLabel} ${nameshuichang} :${params[0].value[1]}`
}
},
textStyle: {
color: 'rgb(250,253,255)'
},
legend: {
// data: ['${nameshuichang}'],
function(name) {
return 'Legend ' + name;
},
textStyle: {//图例文字的样式
color: '#fff',
fontSize: document.body.clientWidth > 2800 ? 20 : 12
},
selectedMode: true,//取消图例上的点击事件
},
// color: ['#ff8734', '#00e6fb', '#3bff38', 'transparent', 'red', 'red'],
grid: {
left: '4%',
right: '4%',
bottom: '12%',
top: '10%',
containLabel: true
},
xAxis: [
{
type: 'time',
axisPointer: {
type: 'shadow'
},
axisLine: {//线
show: false
},
axisTick: {//刻度
show: false
},
splitLine: {
show: false//去掉分割线
},
axisLabel: {
show: true,
color: '#fff',
textStyle: {
fontSize: document.body.clientWidth > 2800 ? 18 : 14 //更改坐标轴文字大小
}
}
}
],
yAxis: [
{
type: 'value',
nameTextStyle: {
fontSize: document.body.clientWidth > 2800 ? 20 : 14
},
axisLine: {//线
show: false
},
axisTick: {//刻度
show: false
},
splitLine: {
show: false,//去掉分割线
lineStyle: {
color: 'rgb(80,80,80)'
}
},
axisLabel: {
show: true,
color: '#fff',
textStyle: {
fontSize: document.body.clientWidth > 2800 ? 18 : 14 //更改坐标轴文字大小
}
},
}
],
dataZoom: [
{
type: 'slider',
xAxisIndex: 0,
filterMode: 'empty',
backgroundColor: 'rgba(1,80,114,0.5)',
fillerColor: 'rgba(35,159,253,.6)',
filterMode: 'none',
start: 0,
end: 100,
handleIcon: 'M10.7,11.9v-1.3H9.3v1.3c-4.9,0.3-8.8,4.4-8.8,9.4c0,5,3.9,9.1,8.8,9.4v1.3h1.3v-1.3c4.9-0.3,8.8-4.4,8.8-9.4C19.5,16.3,15.6,12.2,10.7,11.9z M13.3,24.4H6.7V23h6.6V24.4z M13.3,19.6H6.7v-1.4h6.6V19.6z',
handleSize: '80%',
height: 13,
handleSize: 20,
borderColor: 'rgba(1,80,114,0.5)',
handleStyle: {
color: '#fff',
shadowBlur: 3,
shadowColor: 'rgba(0, 0, 0, 0.6)',
shadowOffsetX: 2,
shadowOffsetY: 2
},
textStyle: {
color: '#fff'
}
},
{
type: 'slider',
yAxisIndex: 0,
filterMode: 'empty',
left: '1%',
backgroundColor: 'rgba(1,80,114,0.5)',
fillerColor: 'rgba(35,159,253,.6)',
filterMode: 'none',
handleIcon: 'M10.7,11.9v-1.3H9.3v1.3c-4.9,0.3-8.8,4.4-8.8,9.4c0,5,3.9,9.1,8.8,9.4v1.3h1.3v-1.3c4.9-0.3,8.8-4.4,8.8-9.4C19.5,16.3,15.6,12.2,10.7,11.9z M13.3,24.4H6.7V23h6.6V24.4z M13.3,19.6H6.7v-1.4h6.6V19.6z',
handleSize: '80%',
width: 13,
handleSize: 20,
borderColor: 'rgba(1,80,114,0.5)',
handleStyle: {
color: '#fff',
shadowBlur: 3,
shadowColor: 'rgba(0, 0, 0, 0.6)',
shadowOffsetX: 2,
shadowOffsetY: 2
},
textStyle: {
color: '#fff'
}
},
{
type: 'inside',
xAxisIndex: 0,
filterMode: 'empty',
backgroundColor: 'rgba(1,80,114,0.5)',
fillerColor: 'rgba(35,159,253,.6)',
filterMode: 'none',
start: 0,
end: 100,
handleIcon: 'M10.7,11.9v-1.3H9.3v1.3c-4.9,0.3-8.8,4.4-8.8,9.4c0,5,3.9,9.1,8.8,9.4v1.3h1.3v-1.3c4.9-0.3,8.8-4.4,8.8-9.4C19.5,16.3,15.6,12.2,10.7,11.9z M13.3,24.4H6.7V23h6.6V24.4z M13.3,19.6H6.7v-1.4h6.6V19.6z',
handleSize: '80%',
height: 13,
handleSize: 20,
borderColor: 'rgba(1,80,114,0.5)',
handleStyle: {
color: '#fff',
shadowBlur: 3,
shadowColor: 'rgba(0, 0, 0, 0.6)',
shadowOffsetX: 2,
shadowOffsetY: 2
},
textStyle: {
color: '#fff'
}
},
{
type: 'slider',
yAxisIndex: 1,
filterMode: 'empty',
backgroundColor: 'rgba(1,80,114,0.5)',
fillerColor: 'rgba(35,159,253,.6)',
filterMode: 'none',
start: 0,
end: 100,
handleIcon: 'M10.7,11.9v-1.3H9.3v1.3c-4.9,0.3-8.8,4.4-8.8,9.4c0,5,3.9,9.1,8.8,9.4v1.3h1.3v-1.3c4.9-0.3,8.8-4.4,8.8-9.4C19.5,16.3,15.6,12.2,10.7,11.9z M13.3,24.4H6.7V23h6.6V24.4z M13.3,19.6H6.7v-1.4h6.6V19.6z',
handleSize: '80%',
width: 13,
handleSize: 20,
borderColor: 'rgba(1,80,114,0.5)',
handleStyle: {
color: '#fff',
shadowBlur: 3,
shadowColor: 'rgba(0, 0, 0, 0.6)',
shadowOffsetX: 2,
shadowOffsetY: 2
},
textStyle: {
color: '#fff'
}
},
],
series: [
{
name: nameshuichang,
type: 'line',
showSymbol: false,
data: a,
// itemStyle: {normal: {opacity: 0}},
// lineStyle: {normal: {opacity: 0}}
},
]
}
myChartzuoixia.setOption(option)
具体修改的代码是
 tooltip: {
                            trigger: 'axis',
                            axisPointer: {
                                // type: 'cross',
                                crossStyle: {
                                    color: '#999'
                                }
                            },
                            textStyle: {
                                fontSize: document.body.clientWidth > 2800 ? 23 : 14
                            },
// 这个是关键
                            formatter: function (params) {
                                // return   console.log(params);
                                let circle = ``;
                                // let data0 = `${circle}params[0].color">`;
                                   let aa=params[0].color
                                // return `${params[0].axisValueLabel}
${data0}
${data1}`;

                                return `${params[0]. axisValueLabel} ${nameshuichang} :${params[0].value[1]}`
                            }
                        },
默认高亮的效果
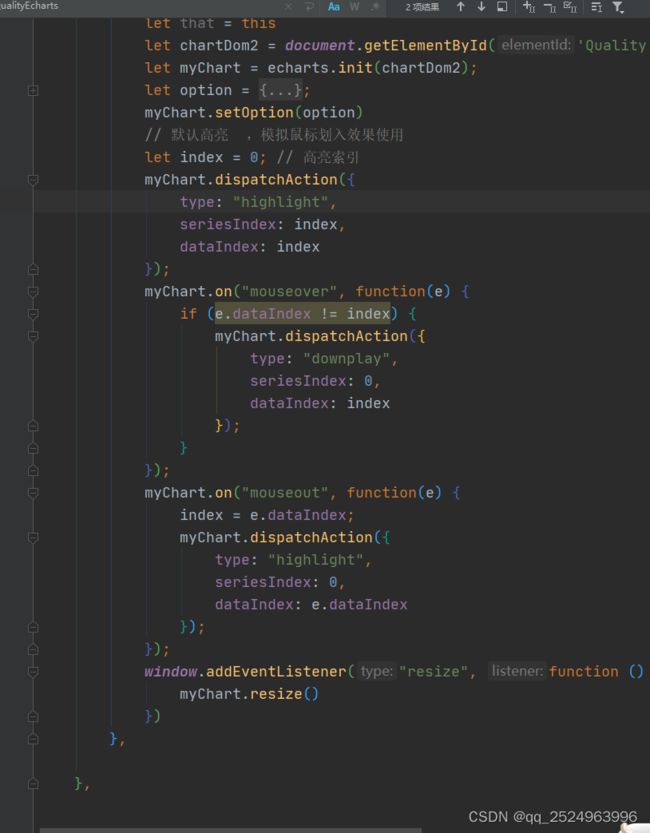
  // 默认高亮  ,模拟鼠标划入效果使用
            let index = 0; // 高亮索引
            myChart.dispatchAction({
                type: "highlight",
                seriesIndex: index,
                dataIndex: index
            });
            myChart.on("mouseover", function(e) {
                if (e.dataIndex != index) {
                    myChart.dispatchAction({
                        type: "downplay",
                        seriesIndex: 0,
                        dataIndex: index
                    });
                }
            });
            myChart.on("mouseout", function(e) {
                index = e.dataIndex;
                myChart.dispatchAction({
                    type: "highlight",
                    seriesIndex: 0,
                    dataIndex: e.dataIndex
                });
            });
            window.addEventListener("resize", function () {
                myChart.resize()
            })
如果字体模糊了 请使用 svg 下方是使用结果 另外是注释的是渐变色
let myChart = echarts.init(chartDom2, null, {renderer: 'svg'}); // 贡献值的echarts
ContributionEcharts() {
let that = this
let chartDom2 = document.getElementById('ContributionEchartsid');
let myChart = echarts.init(chartDom2, null, {renderer: 'svg'});
var salvProMax = [];//背景按最大值
for (let i = 0; i < that.salvProValue.length; i++) {
salvProMax.push(that.salvProValue[0])
}
let option = {
// backgroundColor:"#003366",
grid: {
left: '2%',
right: '2%',
bottom: '-1%',
top: '1%',
containLabel: true
},
tooltip: {
trigger: 'axis',
axisPointer: {
type: 'none'
},
formatter: function (params) {
return params[0].name + ' : ' + params[0].value
}
},
xAxis: {
show: false,
// type: 'value',
splitLine: {
show: false
},
axisTick: {
show: false
},
axisLine: {
show: false
},
},
yAxis: [{
// scale : true,
// max :9,
// min :0,
// splitNumber : 100,
// boundaryGap : [ 0.4, 0.3 ],
// show: true,
type: 'category',
inverse: true,
axisLabel: {
show: true,
textStyle: {
color: '#000000',
fontSize: '16',
//
},
},
splitLine: {
show: false
},
axisTick: {
show: false
},
axisLine: {
show: false
},
data: that.salvProName
}, {
type: 'category',
inverse: true,
axisTick: 'none',
axisLine: 'none',
show: true,
axisLabel: {
margin: -20,
textStyle: {
color: '#000000',
fontSize: '16',
},
},
data: that.salvProValue
}],
series: [{
name: '值',
type: 'bar',
zlevel: 1,
itemStyle: {
normal: {
color: 'rgb( 89,190,255)',
barBorderRadius: [0, 30, 30, 0],
// borderRadius: //(顺时针左上,右上,右下,左下)
// color: new echarts.graphic.LinearGradient(0, 0, 1, 0, [{
// offset: 0,
// color: 'rgb( 89,190,255)'
// }, {
// offset: 1,
// color: 'rgb( 89,190,255)'
// }]),
},
},
barWidth: 17,
data: that.salvProValue
},
{
name: '背景',
type: 'bar',
barWidth: 17,
barGap: '-100%',
data: salvProMax,
itemStyle: {
normal: {
color: 'rgba( 176,230,255,0.3)',
barBorderRadius: 30,
}
},
},
]
};
myChart.setOption(option)
window.addEventListener("resize", function () {
myChart.resize()
})
},
下方是数据
    salvProName: ["王海波", "霍志鹏", "区敏豪", "张章军", "张献翔", "林   勇", "霍志鹏", "霍志鹏", "霍志鹏", "霍志鹏"],
        salvProValue: [239, 181, 154, 144, 135, 117, 74, 72, 67, 55],
传值高亮
myChart.dispatchAction({
                                type: 'highlight',
                                // 可选,系列名称,可以是一个数组指定多个系列
                                // seriesName: items.name,
                                // 可选,数据的 index
                                // dataIndex: number,
                                // // 可选,数据的 名称
                                name: indexs
                            })