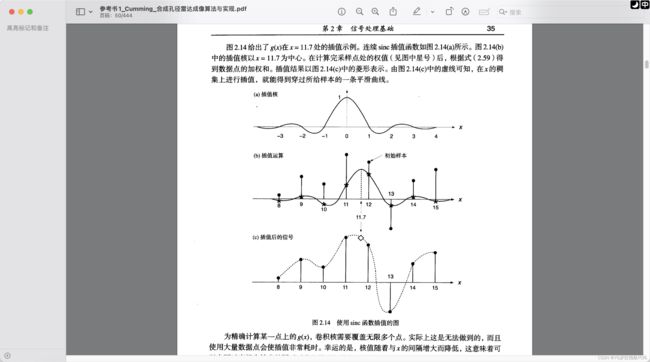
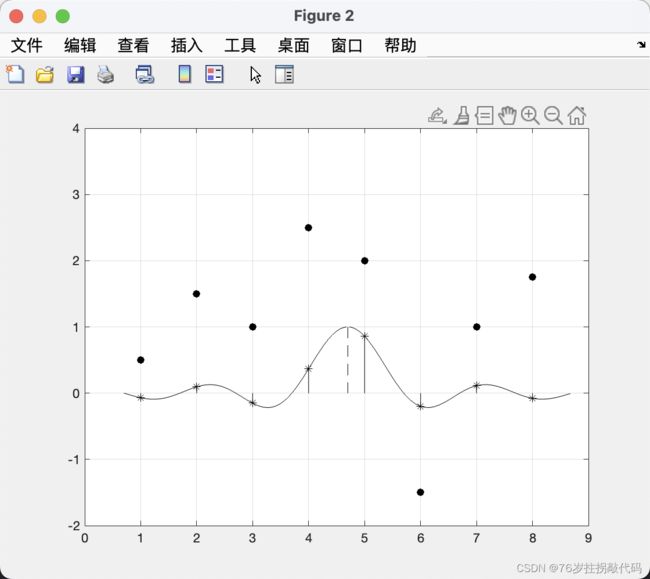
《合成孔径雷达成像算法与实现》Figure2.14
%% 插值核
clc
close all
clear all

N = 40;
x1 = -4:1/N:4-1/N;
hx = sin(pi*x1)./(pi*x1);
if x1 == 0
    hx = 1;
end
figure
plot(x1,hx,'k')
axis([-4 4,-0.4 1.2])
grid on
arrow([-4,0],[4,0],'Color','k','Linewidth',1);
arrow([0,-0.4],[0,1.2],'Color','k','Linewidth',1);
%% 初始样本
x2 = 1:8;
gx = [1,3,2,5,4,-3,2,3.5]/2;
figure
plot(x2,gx,'ko','MarkerFaceColor','k'),hold on
axis([0 9,-2 4])
grid on
% for i =1:8
% line([x2(i),x2(i)],[gx(i),0],'Color','k');
% end
a = 4.7;
plot(x1+a,hx,'k'),hold on,plot(x2,sinc(x2-a),'k*')
for i = 1:8
line([x2(i),x2(i)],[sinc(i-a),0],'Color','k');
end
line([a,a],[sinc(0),0],'Color','k','LineStyle','--')
% 坐标轴
% arrow([0,0],[9,0]);
%% 插值运算
t = 1-a:1:8-a;
gx_a = sinc(t)*gx';
%% 绘图
set(figure,'position',[100,100,800,600])
%插值核
subplot(311),plot(x1,hx,'k');
title('(a)插值核'),xlabel('x1'),ylabel('hx')
axis([-4,4,-0.4,1.2])
grid on

%插值运算
subplot(312),plot(x2,gx,'ko','MarkerFaceColor','k'),hold on
title('(b)插值运算'),xlabel('x2'),ylabel('gx')
plot(x1+a,hx,'k'),hold on
plot(x2,sinc(x2-a),'k*'),hold on
for i = 1:8
    line([x2(i),x2(i)],[sinc(x2(i)-a),0],'color','k')
end
for i = 1:8
    line([x2(i),x2(i)],[gx(i),0],'color','k')
end
line([a,a],[1,0],'color','k','linestyle','--')
grid on

%插值后信号
subplot(313),plot(x2,gx,'ko','MarkerFaceColor','k'),hold on
title('(c)插值后信号'),xlabel('x2'),ylabel('gx_f')
axis([0,9,-2,4])
for i = 1:8
    line([x2(i),x2(i)],[gx(i),0],'color','k')
end
for b = 1:1/N:8-1/N
    t = 1-b:1:8-b
    gx_f = sinc(t)*gx';
    plot(b,gx_f,'k.'),hold on
    if b == a
        plot(b,gx_f,'kd'),hold on
        line([a,a],[gx_f,0],'linestyle','--')
    end
end
sgtitle('图2.14 使用Sinc函数插值的图')
完整代码如下:
%% 插值核
clc
close all
clear all

N = 40;
x1 = -4:1/N:4-1/N;
hx = sin(pi*x1)./(pi*x1);
if x1 == 0
    hx = 1;
end
% figure
% plot(x1,hx,'k')
% axis([-4 4,-0.4 1.2])
% grid on
% arrow([-4,0],[4,0],'Color','k','Linewidth',1);
% arrow([0,-0.4],[0,1.2],'Color','k','Linewidth',1);

%% 初始样本
x2 = 1:8;
gx = [1,3,2,5,4,-3,2,3.5]/2;
% figure
% plot(x2,gx,'ko','MarkerFaceColor','k'),hold on
% axis([0 9,-2 4])
% grid on
% for i =1:8
%     line([x2(i),x2(i)],[gx(i),0],'Color','k');
% end
a = 4.7;
% plot(x1+a,hx,'k'),hold on,plot(x2,sinc(x2-a),'k*')
%
% for i = 1:8
%     line([x2(i),x2(i)],[sinc(i-a),0],'Color','k');
% end
%
% line([a,a],[sinc(0),0],'Color','k','LineStyle','--')

% 坐标轴
% arrow([0,0],[9,0]);

%% 插值运算
t = 1-a:1:8-a;
gx_a = sinc(t)*gx';

%% 绘图
set(figure,'position',[100,100,800,600])
%插值核
subplot(311),plot(x1,hx,'k');
title('(a)插值核'),xlabel('x1'),ylabel('hx')
axis([-4,4,-0.4,1.2])
grid on

%插值运算
subplot(312),plot(x2,gx,'ko','MarkerFaceColor','k'),hold on
title('(b)插值运算'),xlabel('x2'),ylabel('gx')
plot(x1+a,hx,'k'),hold on
plot(x2,sinc(x2-a),'k*'),hold on
for i = 1:8
    line([x2(i),x2(i)],[sinc(x2(i)-a),0],'color','k')
end
for i = 1:8
    line([x2(i),x2(i)],[gx(i),0],'color','k')
end
line([a,a],[1,0],'color','k','linestyle','--')
grid on

%插值后信号
subplot(313),plot(x2,gx,'ko','MarkerFaceColor','k'),hold on
title('(c)插值后信号'),xlabel('x2'),ylabel('gx_f')
axis([0,9,-2,4])
for i = 1:8
    line([x2(i),x2(i)],[gx(i),0],'color','k')
end
for b = 1:1/N:8-1/N
    t = 1-b:1:8-b
    gx_f = sinc(t)*gx';
    plot(b,gx_f,'k.'),hold on
    if b == a
        plot(b,gx_f,'kd'),hold on
        line([a,a],[gx_f,0],'linestyle','--')
    end
end
grid on
sgtitle('图2.14 使用Sinc函数插值的图')


