部署 nagios 监控系统
Nagios
NRPE 是监控软件 nagios 的一个扩展,它被用于被监控的服务器上,向 nagios 监控平台提供该服务器的一些本地的情况。例如,cpu 负载、内存使用、硬盘使用等等。NRPE 可以称为 nagios 的 for linux 客户端。
搭建 nagios 监控系统
安装 apache 和 php
# yum install -y wget httpd php php-devel php-gd gcc glibc glibc-common gd gd-devel make net-snmp
安装 nagios
添加用户,创建安装目录
[root@server ~]# useradd nagios
[root@server ~]# mkdir /nagios
[root@server ~]# chown -R nagios.nagios /nagios
源码编译安装 nagios4.3.4
nagios-4.3.4.tar.gz // 源码包
[root@server ~]# tar xf nagios-4.3.4.tar.gz
[root@server ~]# cd nagios-4.3.4/
[root@server nagios-4.3.4]# ./configure --prefix=/nagios --with-command-group=nagios --with-nagios-group=nagios
编译所有
[root@server nagios-4.3.4]# make all
安装主要的程序、CGI 及 HTML 文件
[root@server nagios-4.3.4]# make install
把 nagios 做成一个运行脚本,使 nagios 随系统开机启动
[root@server nagios-4.3.4]# make install-init
给外部命令访问 nagios 配置文件的权限
[root@server nagios-4.3.4]# make install-commandmode
把配置文件的例子复制到 nagios 的安装目录
[root@server nagios-4.3.4]# make install-config
[root@server nagios-4.3.4]# make install-webconf
把文件复制到安装目录
[root@server nagios-4.3.4]# cp -R contrib/eventhandlers/  /nagios/libexec/
[root@server nagios-4.3.4]# chown -R nagios.nagios /nagios/
检测配置文件是否正常
[root@server nagios-4.3.4]# /nagios/bin/nagios -v /nagios/etc/nagios.cfg
···
Total Warnings: 0
Total Errors:   0

Things look okay - No serious problems were detected during the pre-flight check
配置 httpd,生成 nagios web 界面的验证信息
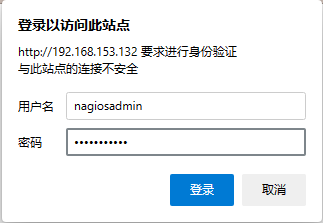
添加登录用户名,回车后输入两次密码,nagiosadmin 是超级用户,密码用的是 nagiosadmin
[root@server nagios-4.3.4]# htpasswd -c /nagios/etc/htpasswd.users nagiosadmin
New password:
Re-type new password:
Adding password for user nagiosadmin
修改/etc/httpd/conf/httpd.conf
[root@server nagios-4.3.4]# vim /etc/httpd/conf/httpd.conf
User = nagios
Group = nagios
#ServerName www.example.com:80
Listen 80    // 监听端口和上面注释保持一致
也可以把 nagios 加入到 apache 组
[root@server nagios-4.3.4]# usermod -G apache nagios
重启 httpd 服务
[root@server ~]# systemctl restart httpd
登录网页查看
http://ip/nagios/
这里需要输入密码,账户密码为之前的设置的 nagiosadmin 账号密码
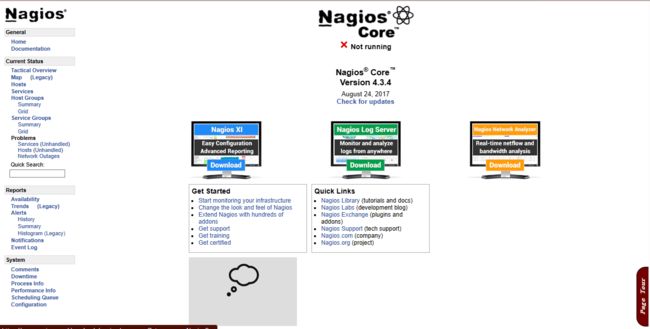
这只是启动了 Nagios 的 Web 容器,而 Nagios 本身实际是没有启动的。
设置开机自启并启动服务
[root@server nagios]# chkconfig nagios on
[root@server nagios]# systemctl start nagios
或
[root@server nagios]# /nagios/bin/nagios -d /nagios/etc/nagios.cfg
查看服务
[root@server nagios]# ps -ef|grep nagios
nagios    87067      1  0 17:40 ?        00:00:00 /nagios/bin/nagios -d /nagios/etc/nagios.cfg
nagios    87068  87067  0 17:40 ?        00:00:00 /nagios/bin/nagios --worker /nagios/var/rw/nagios.qh
nagios    87069  87067  0 17:40 ?        00:00:00 /nagios/bin/nagios --worker /nagios/var/rw/nagios.qh
nagios    87070  87067  0 17:40 ?        00:00:00 /nagios/bin/nagios --worker /nagios/var/rw/nagios.qh
nagios    87071  87067  0 17:40 ?        00:00:00 /nagios/bin/nagios --worker /nagios/var/rw/nagios.qh
nagios    87078  87067  0 17:40 ?        00:00:00 /nagios/bin/nagios -d /nagios/etc/nagios.cfg
root      87105  23861  0 17:40 pts/0    00:00:00 grep --color=auto nagios
配置监控本机
Nagios与插件
Nagios所有的监控、检测功能都是通过各种插件来完成的;插件一般用来监控各类本地资源,比如check_disk。某些插件比如 check_http 之类可以监视远程服务状态(不能控)。
Nagios通过nrpe插件来远程管理服务
nagios-plugins 供(本机的!) nagios 服务调用。
1 安装 nagios-plugins
安装到 nagios 的安装目录
[root@server ~]# tar xf nagios-plugins-1.5.tar.gz
[root@server ~]# cd nagios-plugins-1.5
[root@server nagios-plugins-1.5]# ./configure --prefix=/nagios/ && make && make install
2 安装外部构件 nrpe
nrpe 依赖 openssl-1.0.1e-15.el6.x86_64 和 openssl-devel-1.0.1e-15.el6.x86_64
[root@server ~]# rpm -q openssl openssl-devel
[root@server ~]# yum -y install openssl-devel openssl
[root@server ~]# tar xf nrpe-2.15.tar.gz
[root@server ~]# cd nrpe-2.15
[root@server nrpe-2.15]# ./configure  --prefix=/nagios/nrpe --enable-ssl --with-nagios-user=nagios --with-nagios-group=nagios --with-nrpe-user=nagios --with-nrpe-group=nagios
[root@server nrpe-2.15]# make all
[root@server nrpe-2.15]# make install-plugin
[root@server nrpe-2.15]# make install-daemon
[root@server nrpe-2.15]# make install-plugin
[root@server nrpe-2.15]# make install-xinetd
3 编辑 nrpe 配置文件
增加监控机地址 Nagios-ip 和本机 IP
[root@server ~]# vim /etc/xinetd.d/nrpe
        only_from       = 192.168.153.132,127.0.0.1
4 编辑/nagios/nrpe/etc/nrpe.cfg
[root@server ~]# vim /nagios/nrpe/etc/nrpe.cfg
allowed_hosts=192.168.153.132,127.0.0.1
5 修改 services 文件,增加端口
找到对应行,添加端口
[root@server ~]# vim /etc/services
###UNAUTHORIZED USE: Port 5666 used by SAIC NRPE############
nrpe            5666/tcp                #NRPE
6 启动 nrpe
[root@server ~]# /nagios/nrpe/bin/nrpe -c /nagios/nrpe/etc/nrpe.cfg -d
设置开机启动
如果你发现主机是存活的服务全部不在那就是服务器重启了
[root@server ~]# vim /etc/rc.d/rc.local
/nagios/nrpe/bin/nrpe -c /nagios/nrpe/etc/nrpe.cfg -d
7 nagios 主机设置
了解主要配置文件,默认配置文件在/usr/local/nagios/etc目录下
cgi.cfg    控制 CGI 访问的配置文件

nagios.cfg    Nagios 主配置文件

resource.cfg    变量定义文件,又称为资源文件,在此文件中定义变量,以便由其他配置文件引用,如$USER1$

objects    是一个目录,在此目录下有很多配置文件模板,用于定义 Nagios 对象

objects/commands.cfg    命令定义配置文件,其中定义的命令可以被其他配置文件引用

objects/contacts.cfg    定义联系人和联系人组的配置文件

objects/templates.cfg    定义主机和服务的一个模板配置文件,可以在其他配置文件中引用

objects/timeperiods.cfg    定义 Nagios 监控时间段的配置文件

objects/localhost.cfg    定义监控本地主机的配置文件

objects/printer.cfg    定义监控打印机的一个配置文件模板,默认没有启用此文件

objects/switch.cfg    监控路由器的一个配置文件模板,默认没有启用此文件

objects/windows.cfg    监控 Windows 主机的一个配置文件模板,默认没有启用此文件
可以看出, nagios 各个配置文件之间是互为关联、彼此引用的。成功配置一台 nagios 监控系统,必须弄清楚每个配置文件之间依赖 与被依赖的关系,重要的有四点;
- 定义监控哪些主机、主机组、服务和服务组
- 定义这个监控要用什么命令实现
- 定义监控的时间段
- 定义主机或服务出现问题时要通知的联系人和联系人组
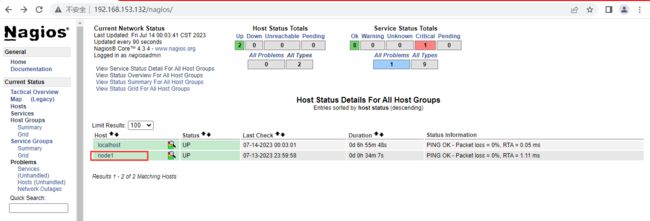
这里无需编辑配置文件,访问 web 网站,点击 hosts ,就可以看到主机已经添加

监控 Linux
1 安装 nrpe
[root@localhost ~]# tar xf nagios-plugins-1.5.tar.gz
[root@localhost ~]# cd nagios-plugins-1.5
[root@localhost nagios-plugins-1.5]# ./configure --prefix=/nagios/ && make && make install
安装外部构建 nrpe,注意需要添加用户,否则安装会报错
[root@localhost ~]# tar xf nrpe-2.15.tar.gz
[root@localhost ~]# cd nrpe-2.15
[root@localhost nrpe-2.15]# ./configure  --prefix=/nagios/nrpe --enable-ssl --with-nagios-user=nagios --with-nagios-group=nagios --with-nrpe-user=nagios --with-nrpe-group=nagios
[root@localhost nrpe-2.15]# useradd nagios
[root@localhost nrpe-2.15]# make all && make install-plugin && make install-daemon && make install-daemon-config && make install-xinetd
编辑 nrpe 配置文件
[root@localhost ~]# vim /etc/xinetd.d/nrpe
        only_from       = 192.168.153.132,127.0.0.1
编辑/nagios/nrpe/etc/nrpe.cfg
[root@localhost ~]# vim /nagios/nrpe/etc/nrpe.cfg
allowed_hosts=192.168.153.132,127.0.0.1
修改 services 文件,增加端口
[root@localhost ~]# vim /etc/services
###UNAUTHORIZED USE: Port 5666 used by SAIC NRPE############
nrpe            5666/tcp                #NRPE
启动 nrpe
[root@localhost ~]# /nagios/nrpe/bin/nrpe -c /nagios/nrpe/etc/nrpe.cfg -d
2 通过 nrpe 监控主机
nrpe 在被监控端和主控端都安装完毕后,就可以通过 nrpe 监控主机
要使用 nrpe 监控主机,需要在主控端把check_nrpe命令在commands.cfg文件中进行定义
[root@server ~]# vim /nagios/etc/objects/commands.cfg
# 'check_nrpe' command definition
define command{
        command_name    check_nrpe
        // 表示定义一个名为 check_nrpe 的命令,以后要使用就可以通过 use 直接引用该命令
        command_line    $USER1$/check_nrpe -H $HOSTADDRESS$ -c $ARG1$
        // 表示要执行的命令,其中 -c 后面只能接被监控主机 nrpe.cfg 中定义的命令名称
        // $ARG1$就是表示被监控主机nrpe.cfg中定义的命令
        }
在 check_nrpe 命令定义完毕后,可以再定义一个 host 和 service 模版在templates.cfg文件中,用于在以后的主机和服务的引用。当然,也可以再单独定义一个 cfg 文件,但是这个单独的 cfg 文件需要在nagios.cfg文件中引用才能正常使用。除此之外,还可以直接使用templates.cfg文件中已经定义好的 host。
在 nrpe 、host 和 service 都定义完成后,就可以开始配置需要监控的主机
[root@server ~]# cp /nagios/etc/objects/localhost.cfg /nagios/etc/objects/localhost.cfg.bak
[root@server ~]# cp /nagios/etc/objects/localhost.cfg /nagios/etc/objects/node1.cfg
[root@server ~]# vim /nagios/etc/objects/node1.cfg
define host{
        use                     linux-server            ; Name of host template to use
                                                        ; This host definition will inherit all variables that are defined
                                                        ; in (or inherited by) the linux-server host template definition.
        host_name               node1
        alias                   node1
        address                 192.168.153.133
        }


define hostgroup{
        hostgroup_name  node-servers ; The name of the hostgroup
        alias           node Servers ; Long name of the group
        members         node1     ; Comma separated list of hosts that belong to this group
        }


define service{
        use                             local-service         ; Name of service template to use
        host_name                       node1
        service_description             nrpe_load
        check_command                   check_nrpe!check_load
        }

[root@server ~]# chown nagios:nagios /nagios/etc/objects/node1.cfg
[root@server ~]#
在nagios.cfg添加环境变量,增加cfg_file字段
[root@server ~]# vim /nagios/etc/nagios.cfg
cfg_file=/nagios/etc/objects/node1.cfg
如果你想要把所所有的主机 cfg 文件存放到同一个目录下,来达到引用的目的,可以编辑主配置文件nagios.cfg中的cfg_dir字段来指定你的目录。再到这个目录中创建你的 cfg 文件。
使用 nagios 的配置文件验证检查
[root@server ~ ]# /etc/init.d/nagios configtest

Nagios Core 4.3.4
Copyright (c) 2009-present Nagios Core Development Team and Community Contributors
Copyright (c) 1999-2009 Ethan Galstad
Last Modified: 2017-08-24
License: GPL

Website: https://www.nagios.org
Reading configuration data...
   Read main config file okay...
   Read object config files okay...

Running pre-flight check on configuration data...

Checking objects...
        Checked 9 services.
        Checked 2 hosts.
        Checked 2 host groups.
        Checked 0 service groups.
        Checked 1 contacts.
        Checked 1 contact groups.
        Checked 25 commands.
        Checked 5 time periods.
        Checked 0 host escalations.
        Checked 0 service escalations.
Checking for circular paths...
        Checked 2 hosts
        Checked 0 service dependencies
        Checked 0 host dependencies
        Checked 5 timeperiods
Checking global event handlers...
Checking obsessive compulsive processor commands...
Checking misc settings...

Total Warnings: 0
Total Errors:   0

Things look okay - No serious problems were detected during the pre-flight check
Object precache file created:
/nagios/var/objects.precache
Checked 2 hosts. 检测到两个 host ,没有报错,成功
到 web 界面查看
监控 Windows
Nagios对Windows主机的监控主要有三种方法
- 第一种是NSclient++
- 第二种是NRPE
- 第三种是SNMP(不是很常用)
NSclient++ 与 nrpe 的区别:
- 被监控机上安装有 nrpe,并且还有插件,最终的监控是由这些插件来进行的。当监控主机将监控请求发给 nrpe 后,nrpe 调用插件来完成监控.
- NSclient++ 则不同,被监控机上只安装 NSclient++,没有任何的插件,当监控主机将监控请求发给NSclient++ 后,NSclient++ 直接完成监控,所有的监控是由 NSclient++ 完成的。
这也说明了NSclient++的一个很大的问题,不灵活,没有可扩展性,它只能完成自己本身包含的监控操作,不能由一些插件来扩展,好在NSclient++已经做的不错了,基本上可以完全满足我们的监控需要。
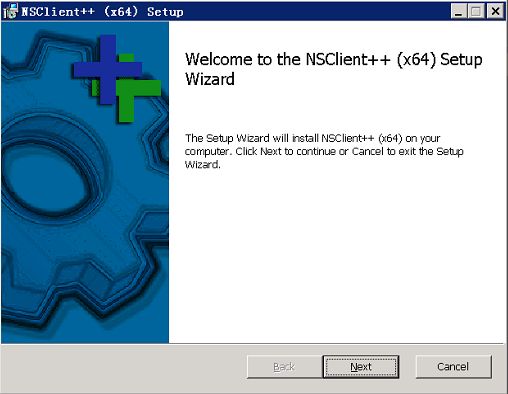
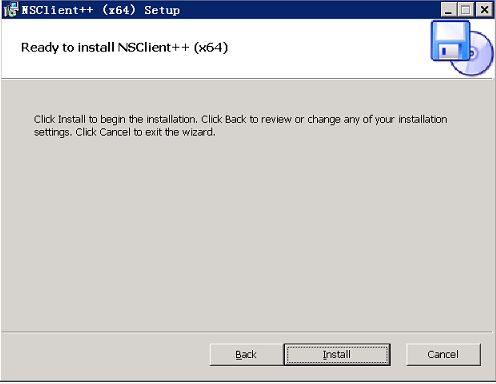
1 安装 NSclient++
下载地址:http://sourceforge.net/projects/nscplus/files/nscplus/
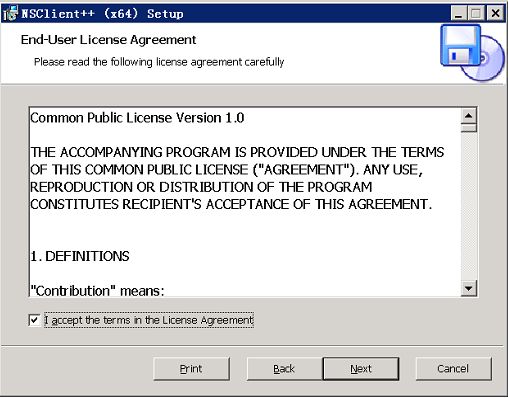
Typical:安装最常见的程序功能。建议大多数用户使用。
Custom:允许用户选择要安装的程序功能以及安装位置,建议高级用户使用。
Complete:将安装所有程序功能。需要最多的磁图空间。


Allowed hosts:(this is the IP of the nagios (or other)server)
允许的主机地址:Nagios服务器端的IP地址
NSClient password(only userd via check_nt)
NSClient的密码:填写Nagios跟NSClient++进程通信的密码,可以不设置
Modules to load:
安装并加载相应的模块:NSClient++自带的有check_plugins插件,check_nt、check_nrpe、NSCA、WMI,在这里我们全部选择,以后会有用到的

启动 NSClient++

查看 NSClient++ 服务是否已经启用

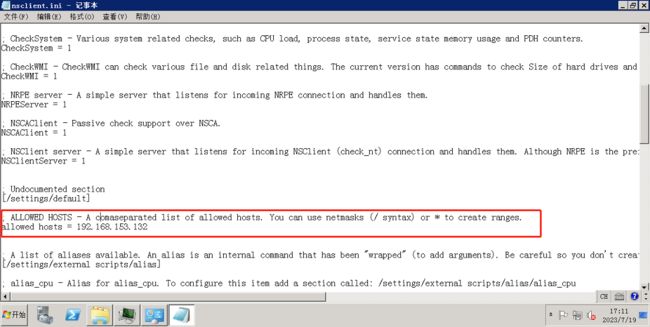
2 查看 NSClient++ 的配置文件
路径在C:\Program Files\NSClient++
一般无需修改,但当监控端的IP地址改变时,或者密码忘记,即可以在这里修改

设置允许连接的地址
3 NSClient 应用监控
NSClient++ 与 Nagios 服务器通信,主要使用 Nagios 服务器的 check_nt 插件。原理图如下
查看 check_nt 帮助
[root@server libexec]# pwd
/nagios/libexec
[root@server libexec]# ./check_nt -h
check_nt v1.5 (nagios-plugins 1.5)
Copyright (c) 2000 Yves Rubin ([email protected])
Copyright (c) 2000-2007 Nagios Plugin Development Team


This plugin collects data from the NSClient service running on a
Windows NT/2000/XP/2003 server.


Usage:
check_nt -H host -v variable [-p port] [-w warning] [-c critical]
[-l params] [-d SHOWALL] [-u] [-t timeout]

Options:
 -h, --help
    Print detailed help screen
 -V, --version
    Print version information
Options:
 -H, --hostname=HOST
   Name of the host to check
 -p, --port=INTEGER
   Optional port number (default: 1248)
 -s, --secret=
   Password needed for the request
 -w, --warning=INTEGER
   Threshold which will result in a warning status
 -c, --critical=INTEGER
   Threshold which will result in a critical status
 -t, --timeout=INTEGER
   Seconds before connection attempt times out (default:  -l, --params=
   Parameters passed to specified check (see below) -d, --display={SHOWALL}
   Display options (currently only SHOWALL works) -u, --unknown-timeout
   Return UNKNOWN on timeouts10)
 -h, --help
   Print this help screen
 -V, --version
   Print version information
 -v, --variable=STRING
   Variable to check

Valid variables are:
 CLIENTVERSION = Get the NSClient version
  If -l  is specified, will return warning if versions differ.
 CPULOAD =
  Average CPU load on last x minutes.
  Request a -l parameter with the following syntax:
  -l ,,.
   should be less than 24*60.
  Thresholds are percentage and up to 10 requests can be done in one shot.
  ie: -l 60,90,95,120,90,95
 UPTIME =
  Get the uptime of the machine.
  No specific parameters. No warning or critical threshold
 USEDDISKSPACE =
  Size and percentage of disk use.
  Request a -l parameter containing the drive letter only.
  Warning and critical thresholds can be specified with -w and -c.
 MEMUSE =
  Memory use.
  Warning and critical thresholds can be specified with -w and -c.
 SERVICESTATE =
  Check the state of one or several services.
  Request a -l parameters with the following syntax:
  -l ,,,...
  You can specify -d SHOWALL in case you want to see working services
  in the returned string.
 PROCSTATE =
  Check if one or several process are running.
  Same syntax as SERVICESTATE.
 COUNTER =
  Check any performance counter of Windows NT/2000.
        Request a -l parameters with the following syntax:
        -l "\\\\counter","
        The  parameter is optional and is given to a printf
  output command which requires a float parameter.
  If  does not include "%%", it is used as a label.
  Some examples:
  "Paging file usage is %%.2f %%%%"
  "%%.f %%%% paging file used."
 INSTANCES =
  Check any performance counter object of Windows NT/2000.
  Syntax: check_nt -H  -p  -v INSTANCES -l
   is a Windows Perfmon Counter object (eg. Process),
  if it is two words, it should be enclosed in quotes
  The returned results will be a comma-separated list of instances on
   the selected computer for that object.
  The purpose of this is to be run from command line to determine what instances
   are available for monitoring without having to log onto the Windows server
    to run Perfmon directly.
  It can also be used in scripts that automatically create Nagios service
   configuration files.
  Some examples:
  check_nt -H 192.168.1.1 -p 1248 -v INSTANCES -l Process

Notes:
 - The NSClient service should be running on the server to get any information
   (http://nsclient.ready2run.nl).
 - Critical thresholds should be lower than warning thresholds
 - Default port 1248 is sometimes in use by other services. The error
   output when this happens contains "Cannot map xxxxx to protocol number".
   One fix for this is to change the port to something else on check_nt
   and on the client service it's connecting to.

Send email to [email protected] if you have questions
regarding use of this software. To submit patches or suggest improvements,
send email to [email protected]
定义命令
[root@server objects]# pwd
/nagios/etc/objects
[root@server objects]# vim commands.cfg
····
# 'check_nt' command definition
define command{
        command_name    check_nt
        command_line    $USER1$/check_nt -H $HOSTADDRESS$ -p 12489 -v $ARG1$ $ARG2$
        }
// 这里已经有 check_nt 的命令
定义主机和服务
[root@server objects]# cp windows.cfg windows2008.cfg
[root@server objects]# sed -i 's/winserver/windows2008/g' windows2008.cfg
[root@server objects]# sed -i 's/192.168.1.2/192.168.153.132/g' windows2008.cfg
主配置文件中添加监控主机配置文件
[root@server etc]# pwd
/nagios/etc
[root@server etc]# vim nagios.cfg
cfg_file=/nagios/etc/objects/windows2008.cfg
检查语法错误
[root@server objects]# service nagios configtest

Nagios Core 4.3.4
Copyright (c) 2009-present Nagios Core Development Team and Community Contributors
Copyright (c) 1999-2009 Ethan Galstad
Last Modified: 2017-08-24
License: GPL

Website: https://www.nagios.org
Reading configuration data...
   Read main config file okay...
   Read object config files okay...

Running pre-flight check on configuration data...

Checking objects...
        Checked 23 services.
        Checked 3 hosts.
        Checked 3 host groups.
        Checked 0 service groups.
        Checked 1 contacts.
        Checked 1 contact groups.
        Checked 25 commands.
        Checked 5 time periods.
        Checked 0 host escalations.
        Checked 0 service escalations.
Checking for circular paths...
        Checked 3 hosts
        Checked 0 service dependencies
        Checked 0 host dependencies
        Checked 5 timeperiods
Checking global event handlers...
Checking obsessive compulsive processor commands...
Checking misc settings...

Total Warnings: 0
Total Errors:   0

Things look okay - No serious problems were detected during the pre-flight check
Object precache file created:
/nagios/var/objects.precache
重启服务
[root@server objects]# service nagios restart
Restarting nagios (via systemctl):                         [  确定  ]
