【python】OpenCV—Edge, Corner, Face Detection(3)
学习参考
- 使用Python+OpenCV进行图像处理(三)| 视觉入门
前文链接
- 【python】OpenCV—RGB, Rectangle, Circle, SS(1)
- 【python】OpenCV—Blur, Threshold, Gradient, Morphology(2)
- 【python】OpenCV—Edge, Corner, Face Detection(3)
文章目录
- 0 import
- 1 Edge Detection(Canny)
- 2 Corner Detection
-
- 2.1 Harris Corner Detection
- 2.2 Shi&Tomasi Corner Detection
- 3 Face Detection
- 4 肖像画
0 import
import cv2
import numpy as np
import matplotlib.pyplot as plt

%matplotlib inline
1 Edge Detection(Canny)
边缘检测本质上是检测图像中变化剧烈或者不连续的像素点。将这些像素点连接线段即为边。实际上,在【python】OpenCV—Blur, Threshold, Gradient, Morphology(2)中我们已经介绍了一种基础的边缘检测技术:使用 Sobel 算子和拉普拉斯算子进行梯度滤波。通过计算图像像素值在给定方向上的导数,梯度滤波器即可以描绘出图像的边缘从而实现边缘检测。
Canny检测算法是另外一种图像边缘检测技术。而且是目前最流行的边缘检测技术之一,分为以下四个步骤实现:
- 降噪:高斯模糊
- 判断梯度及梯度方向:sobel
- 非最大值抑制:使用得到的梯度,检测每一个像素点与其中周围的像素点,确认这个像素点是不是这些局部像素点中的局部最大值。如果不是局部最大值,则将这个点的像素值置为零(完全缺失,黑色)
- 滞后阈值化处理:接着第三步的结果,给定两个不同的阈值,我们可以得到三个阈值化区间。因此,如果这个点的像素值大于两个阈值中的“较大阈值” 则被判定为边缘点。相对地,如果其小于所设定的两个阈值参数中的“较小阈值” 则被认定为非边缘点,即会被丢弃。另外,如果这个点的像素值位于两个参数阈值之间则是跟据其是否与”确认边缘点“之间有连接来决定是否丢弃,遵循有连接则不丢弃的原则。

感觉这个图画错了,A,B,C 三个点,B 如果梯度值最大(edges),会是255,然后把 AC抑制成0,这里面第二个图把B赋值成0了!(不清楚我一直以来的理解是否有误)
coding 一下,核心函数 cv2.Canny
img = cv2.imread('C://Users/13663//Desktop/4.png')
img = cv2.cvtColor(img, cv2.COLOR_BGR2RGB)

# Canny detection without blurring
edges = cv2.Canny(image=img, threshold1=127, threshold2=127)

plt.figure(figsize = (20, 20))
plt.subplot(1, 2, 1)
plt.title("original image",fontsize=24,color='white')
plt.imshow(img)
plt.axis('off')

plt.subplot(1, 2, 2)
plt.title("canny",fontsize=24,color='white')
plt.imshow(edges,cmap='gray')
plt.axis('off')
这里只设置了一个阈值
# Set the lower and upper threshold
med_val = np.median(img)
lower = int(max(0, .7*med_val))
upper = int(min(255, 1.3*med_val))
print(med_val,lower,upper)
output
97.0 67 126
再调用一下 cv2.Canny,在高斯滤波之前用了三种不同 kernel 的均值滤波!大的阈值,有 +100 和 不加 100 的区别!总共六种组合!
# Blurring with ksize = 3
img_k3 = cv2.blur(img, ksize = (3, 3))
# Canny detection with different thresholds
edges_k3 = cv2.Canny(img_k3, threshold1 = lower, threshold2 = upper)
edges_k3_2 = cv2.Canny(img_k3, lower, upper+100)

# Blurring with ksize = 5
img_k5 = cv2.blur(img, ksize = (5, 5))
# Canny detection with different thresholds
edges_k5 = cv2.Canny(img_k5, lower, upper)
edges_k5_2 = cv2.Canny(img_k5, lower, upper+100)

# Blurring with ksize = 7
img_k7 = cv2.blur(img, ksize = (7, 7))
# Canny detection with different thresholds
edges_k7 = cv2.Canny(img_k7, threshold1 = lower, threshold2 = upper)
edges_k7_2 = cv2.Canny(img_k7, lower, upper+100)

# Plot the images
names = ['k3, l, u', 'k5, l, u', 'k7, l, u', 'k3, l, u+100', 'k5, l, u+100', 'k7, l, u+100']
images = [edges_k3, edges_k5, edges_k7, edges_k3_2, edges_k5_2, edges_k7_2]
plt.figure(figsize = (20, 14))
for i in range(6):
    plt.subplot(2, 3, i+1)
    plt.title(names[i],fontsize=24,color='w')
    plt.imshow(images[i],cmap='gray')
    plt.axis('off')
plt.show()
2 Corner Detection
Harris 角点检测和 Shi&Tomasi 角点检测
这两种算法的工作原理如下。首先,检测出各个方向上像素强度值有很大变化的点。然后构造一个矩阵,从中提取特征值。通过这些特征值进行评分从而决定它是否是一个角。数学表达式如下所示。
cv2.cornerHarris()cv2.goodFeaturesToTrack()
2.1 Harris Corner Detection
核心函数 cv2.cornerHarris() 参数如下:
- img - 数据类型为 float32 的输入图像。
- blockSize - 角点检测中要考虑的领域大小。
- ksize - Sobel 求导中使用的窗口大小
- k - Harris 角点检测方程中的自由参数,取值参数为 [0,04,0.06]. k Harris detector free parameter.
#img = cv2.imread('C://Users/13663//Desktop/1.jpg')
img = cv2.imread('C://Users/13663//Desktop/7.png')
img = cv2.cvtColor(img, cv2.COLOR_BGR2RGB)
img_gray = cv2.cvtColor(img, cv2.COLOR_RGB2GRAY)
# Apply Harris corner detection
dst = cv2.cornerHarris(img_gray, blockSize = 8, ksize = 3, k = .04)
# Spot the detected corners
img_2 = img.copy()
img_2[dst>0.01*dst.max()]=[255,0,0]
# Plot the image
plt.figure(figsize = (20, 20))
plt.subplot(1, 2, 1); plt.imshow(img)
plt.axis('off')
plt.subplot(1, 2, 2); plt.imshow(img_2)
plt.axis('off')
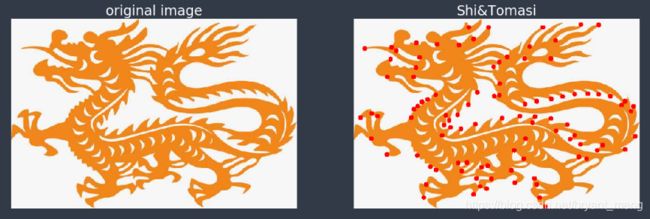
2.2 Shi&Tomasi Corner Detection
核心函数 cv2.goodFeaturesToTrack() 参数的解释可以参考 Good Features to track特征点检测原理与opencv(python)实现
# Apply Shi-Tomasi corner detection
corners = cv2.goodFeaturesToTrack(img_gray, maxCorners = 100,
                                  qualityLevel = 0.01,
                                  minDistance = 10)
corners = np.int0(corners)
# Spot the detected corners
img_2 = img.copy()
for i in corners:
    x,y = i.ravel()
    cv2.circle(img_2, center = (x, y),
               radius = 5, color = 255, thickness = -1)
# Plot the image
plt.figure(figsize = (20, 20))
plt.subplot(1, 2, 1); plt.imshow(img)
plt.axis('off')
plt.subplot(1, 2, 2); plt.imshow(img_2)
plt.axis('off')
3 Face Detection
基于 Haar 特征的级联分类器是 OpenCV 中常用的人脸检测模型之一。它已经在数千副图像上进行过预训练。理解该算法的四个关键点分别是:
1)Haar 特征提取
在检测过程中,通过滑动窗口和滤波器上的卷积操作来确认这些特征是不是我们所需要的特征。如下方所示:
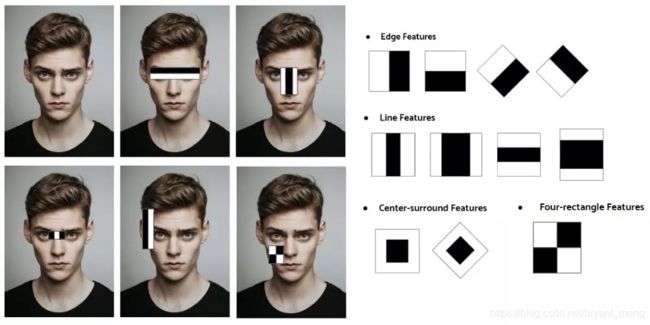
那么,我们具体如何来确定给定区域是否含有需要的特征呢? 如上方图片中所示。使用一个特定卷积核(上半区域是暗的,下半区域是亮的)得到每个区域像素值的平均值,并减去两者之间的差距。如果结果高于阈值(比如0.5),则可得出结果,其就是我们正在检测的特征。对每个内核重复这个过程,同时在图像上滑动窗口。
2)积分图像
虽然这个计算过程并不复杂,但如果在正个图像重复这个过程计算量还是很大的。这也是积分图像要解决的主要问题。积分图像是一种图像表示方式,它是为了提高特征估计的速度与效率而衍生出来的。
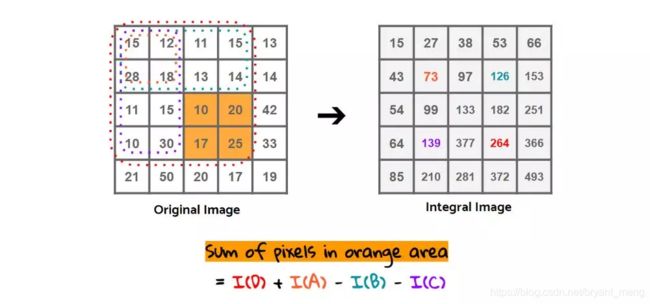
积分图上每个点的值为原图中该点到左上角点所围成的矩形的所有像素之和!
计算橘色区域的面积,会计算两次减法和一次加法,参考 积分图像(Integral Image)与积分直方图 (Integral Histogram)
- 积分图:264 - 139 - 126 + 73 = 72
- 原图:10 + 20 + 17 +25 = 72
3)Adaboost 和 级联分类器
所以积分图像可以帮助我们在一定程度上解决计算量过大的问题。但还不够,还存在着计算量优化的空间。当检测窗口位于没有目标或人脸的空白背景时,执行检测则会耗费不必要的计算量。这时就可以通过使用 Adaboost 和级联分类器,从而实现计算量进一步优化。

上图展示了级联分类器逐步构造的各个阶段,并对 类haar 特征(类haar特征(Haar-like features)是用于目标检测的数字图像特征)进行排序。基本特征会在早期阶段被识别出来,后期只识别有希望成为目标特征的复杂特征。在每一个阶段,Adaboost 模型都将由集成弱分类器进行训练。如果子部件或子窗口在前一阶段被分类为“不像人脸的区域”,则将被拒绝进入下一步。通过上述操作,只须考虑上一阶段筛选出来的特征,从而实现更高的速度。
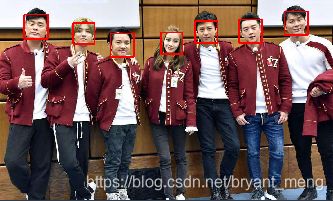
下面来实战一下
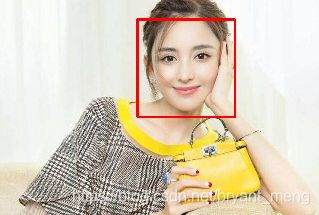
cap_mavl = cv2.imread('C://Users/13663//Desktop/12.png')
# Find the region of interest
roi = cap_mavl[0:235,265:475]
roi = cv2.cvtColor(roi, cv2.COLOR_BGR2RGB)
plt.imshow(roi)
plt.axis("off")
# Create the face detecting function
def detect_face(img):
    img_2 = img.copy()
    # Load Cascade filter
    face_cascade = cv2.CascadeClassifier('D://software/opencv/sources/data/haarcascades/haarcascade_frontalface_default.xml')
    face_rects = face_cascade.detectMultiScale(img_2,
                                               scaleFactor = 1.1,
                                               minNeighbors = 10)

    for (x, y, w, h) in face_rects:
        cv2.rectangle(img_2, (x, y), (x+w, y+h), (255, 0, 0), 3)

    return img_2
# Detect the face
roi_detected = detect_face(roi)
plt.imshow(roi_detected)
plt.axis('off')
detectMultiScale 的参数含义如下:
- image:待检测图片,一般为灰度图像加快检测速度;
- scaleFactor:表示在前后两次相继的扫描中,搜索窗口的比例系数。默认为1.1,即每次搜索窗口依次扩大10%;
- minNeighbors:表示构成检测目标的相邻矩形的最小个数(默认为3个)。如果组成检测目标的小矩形的个数和小于 min_neighbors - 1 都会被排除。如果min_neighbors 为 0, 则函数不做任何操作就返回所有的被检候选矩形框,这种设定值一般用在用户自定义对检测结果的组合程序上;
注意 cv2.CascadeClassifier 的路径,在自己 opencv 所在的文件夹,具体如下:
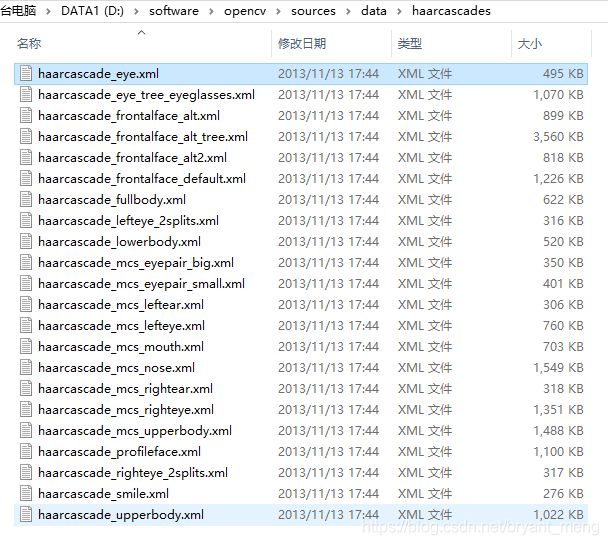

也可以试试其它的检测,比如眼睛的检测,修改上述代码中的
face_cascade = cv2.CascadeClassifier('D://software/opencv/sources/data/haarcascades/haarcascade_eye.xml')
结果如下:
# Create the face detecting function
def detect_face(img):
    img_2 = img.copy()
    # Load Cascade filter
    face_cascade = cv2.CascadeClassifier('D://software/opencv/sources/data/haarcascades/haarcascade_frontalface_default.xml')
    face_rects = face_cascade.detectMultiScale(img_2,
                                               scaleFactor = 1.1,
                                               minNeighbors = 3)

    for (x, y, w, h) in face_rects:
        cv2.rectangle(img_2, (x, y), (x+w, y+h), (255, 0, 0), 3)

    return img_2

# Load the image file and convert the color mode
avengers = cv2.imread('C://Users/13663//Desktop/12.png')
avengers = cv2.cvtColor(avengers, cv2.COLOR_BGR2RGB)
# Detect the face and plot the result
detected_avengers = detect_face(avengers)
plt.imshow(detected_avengers)
plt.axis('off')
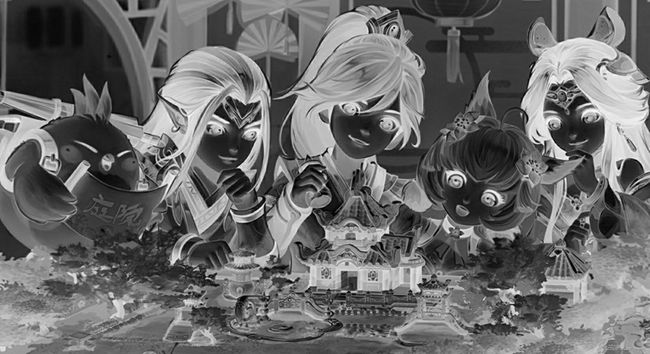
4 肖像画
import cv2

import os
# print(os.listdir("../../datasets/human_Wild_public/images/mpii_029329465.jpg"))
img = cv2.imread("C://Users/Administrator/Desktop/1.jpeg")

gray_img = cv2.cvtColor(img, cv2.COLOR_BGR2GRAY)
invert_g_i = 255 - gray_img

blurred_i_g_i = cv2.GaussianBlur(invert_g_i, (19, 19), 0)

invert = 255 - blurred_i_g_i

sketck = cv2.divide(gray_img, invert, scale=256.0)
cv2.imwrite("C://Users/Administrator/Desktop/2.jpeg", sketck)

# cv2.imshow("ori", img)
# cv2.imshow("pencil sketch", sketck)
# cv2.waitKey(0)


