【python】Visualization of field data(NBA)
文章目录
- 1 画篮球场
- 2 爬数据
- 3 可视化投篮结果
- 4 Kobe Bryant
- 5 Others
代码来源:
-
用Python把NBA球员投篮数据可视化
-
虎扑热帖|数据分析|用python展示NBA球员出手喜好
1 画篮球场
from matplotlib import pyplot as plt
from matplotlib.patches import Arc, Circle, Rectangle
%matplotlib inline

def draw_ball_field(color='#20458C', lw=2):
    """
    绘制篮球场
    """
    # 新建一个大小为(6,6)的绘图窗口
    plt.figure(figsize=(9, 9))
    # 获得当前的Axes对象ax,进行绘图
    ax = plt.gca()

    # 对篮球场进行底色填充
    lines_outer_rec = Rectangle(xy=(-250, -47.5), width=500, height=470, linewidth=lw, color='#F0F0F0', fill=True)
    # 设置篮球场填充图层为最底层
    lines_outer_rec.set_zorder(0)
    # 将rec添加进ax
    ax.add_patch(lines_outer_rec)

    # 绘制篮筐,半径为7.5
    circle_ball = Circle(xy=(0, 0), radius=7.5, linewidth=lw, color=color, fill=False)
    # 将circle添加进ax
    ax.add_patch(circle_ball)

    # 绘制篮板,尺寸为(60,1)
    plate = Rectangle(xy=(-30, -7.5), width=60, height=-1, linewidth=lw, color=color, fill=False)
    # 将rec添加进ax
    ax.add_patch(plate)

    # 绘制2分区的外框线,尺寸为(160,190)
    outer_rec = Rectangle(xy=(-80, -47.5), width=160, height=190, linewidth=lw, color=color, fill=False)
    # 将rec添加进ax
    ax.add_patch(outer_rec)

    # 绘制2分区的内框线,尺寸为(120,190)
    inner_rec = Rectangle(xy=(-60, -47.5), width=120, height=190, linewidth=lw, color=color, fill=False)
    # 将rec添加进ax
    ax.add_patch(inner_rec)

    # 绘制罚球区域圆圈,半径为60
    circle_punish = Circle(xy=(0, 142.5), radius=60, linewidth=lw, color=color, fill=False)
    # 将circle添加进ax
    ax.add_patch(circle_punish)

    # 绘制三分线的左边线
    three_left_rec = Rectangle(xy=(-220, -47.5), width=0, height=140, linewidth=lw, color=color, fill=False)
    # 将rec添加进ax
    ax.add_patch(three_left_rec)

    # 绘制三分线的右边线
    three_right_rec = Rectangle(xy=(220, -47.5), width=0, height=140, linewidth=lw, color=color, fill=False)
    # 将rec添加进ax
    ax.add_patch(three_right_rec)

    # 绘制三分线的圆弧,圆心为(0,0),半径为238.66,起始角度为22.8,结束角度为157.2
    three_arc = Arc(xy=(0, 0), width=477.32, height=477.32, theta1=22.8, theta2=157.2, linewidth=lw, color=color, fill=False)
    # 将arc添加进ax
    ax.add_patch(three_arc)

    # 绘制中场处的外半圆,半径为60
    center_outer_arc = Arc(xy=(0, 422.5), width=120, height=120, theta1=180, theta2=0, linewidth=lw, color=color, fill=False)
    # 将arc添加进ax
    ax.add_patch(center_outer_arc)

    # 绘制中场处的内半圆,半径为20
    center_inner_arc = Arc(xy=(0, 422.5), width=40, height=40, theta1=180, theta2=0, linewidth=lw, color=color, fill=False)
    # 将arc添加进ax
    ax.add_patch(center_inner_arc)

    # 绘制篮球场外框线,尺寸为(500,470)
    lines_outer_rec = Rectangle(xy=(-250, -47.5), width=500, height=470, linewidth=lw, color=color, fill=False)
    # 将rec添加进ax
    ax.add_patch(lines_outer_rec)

    return ax
调用一下
axs = draw_ball_field(color='#20458C', lw=2)

# 设置坐标轴范围
axs.set_xlim(-250, 250)
axs.set_ylim(422.5, -47.5)
# 消除坐标轴刻度
axs.set_xticks([])
axs.set_yticks([])
# 添加备注信息
plt.annotate('By xiao F', xy=(100, 160), xytext=(178, 418))
plt.show()
2 爬数据
import requests
import json

headers = {
        'User-Agent': 'Mozilla/5.0 (Windows NT 6.1; WOW64) AppleWebKit/537.36 (KHTML, like Gecko) Chrome/63.0.3239.132 Safari/537.36'
    }

def shot_data(years,player_id):
    # years 球员职业生涯时间, list
    # player_id 球员ID, str
    for i in range(years[0], years[1]):
        # 赛季
        season = str(i) + '-' + str(i + 1)[-2:]

        # 请求网址
        url = 'https://stats.nba.com/stats/shotchartdetail?AheadBehind=&CFID=33&CFPARAMS=' + season + '&ClutchTime=&Conference=&ContextFilter=&ContextMeasure=FGA&DateFrom=&DateTo=&Division=&EndPeriod=10&EndRange=28800&GROUP_ID=&GameEventID=&GameID=&GameSegment=&GroupID=&GroupMode=&GroupQuantity=5&LastNGames=0&LeagueID=00&Location=&Month=0&OnOff=&OpponentTeamID=0&Outcome=&PORound=0&Period=0&PlayerID=' + player_id + '&PlayerID1=&PlayerID2=&PlayerID3=&PlayerID4=&PlayerID5=&PlayerPosition=&PointDiff=&Position=&RangeType=0&RookieYear=&Season=' + season + '&SeasonSegment=&SeasonType=Regular+Season&ShotClockRange=&StartPeriod=1&StartRange=0&StarterBench=&TeamID=0&VsConference=&VsDivision=&VsPlayerID1=&VsPlayerID2=&VsPlayerID3=&VsPlayerID4=&VsPlayerID5=&VsTeamID='

        # 请求结果
        response = requests.get(url=url, headers=headers)
        result = json.loads(response.text)

        # 获取数据
        for item in result['resultSets'][0]['rowSet']:
            flag = item[10] # 是否进球得分
            loc_x = str(item[17]) # 横坐标
            loc_y = str(item[18])  # 纵坐标

            with open('curry.csv', 'a+') as f:
                f.write(loc_x + ',' + loc_y + ',' + flag + '\n')
调用一下
years = [2017, 2019]# 球员职业生涯时间
player_id = '201939'# 球员ID
shot_data(years,player_id)
201939 是 Stephen Curry
生成
![]()
如下所示:

3 可视化投篮结果
import pandas as pd
import urllib.request
from matplotlib.offsetbox import  OffsetImage

def draw_shot(player_id):
    # 读取数据
    df = pd.read_csv('curry.csv', header=None, names=['width', 'height', 'type'])
    # 分类数据
    df1 = df[df['type'] == 'Made Shot']
    df2 = df[df['type'] == 'Missed Shot']

    # 画篮球场
    axs = draw_ball_field(color='#20458C', lw=2)

    # 绘制散点图
    axs.scatter(x=df2['width'], y=df2['height'], s=30, marker='x', color='#A82B2B')
    axs.scatter(x=df1['width'], y=df1['height'], s=30, marker='o', edgecolors='#3A7711', color="#F0F0F0", linewidths=2)

    # 设置坐标轴范围
    axs.set_xlim(-250, 250)
    axs.set_ylim(422.5, -47.5)

    # 消除坐标轴刻度
    axs.set_xticks([])
    axs.set_yticks([])

    # 添加备注信息
    plt.annotate('By Bryant', xy=(90, 160), xytext=(190, 418))

    # 画头像
    pic = urllib.request.urlretrieve("http://stats.nba.com/media/players/230x185/" + player_id + ".png")
    head_pic = plt.imread(pic[0])  # urlretrieve 返回元组,image 在第一个
    img = OffsetImage(head_pic, zoom=0.6) # 将球员图片放置于左下角,并设置缩小等级以配合整个图片
    img.set_offset((45,45))  # (x, y) 控制将球员放在你想要放的位置
    axs.add_artist(img)      # 添加球员图片

    plt.show()
调用一下(只用了17,19年的数据)
draw_shot('201939')
4 Kobe Bryant
Kobe Bryant 是 977,球员 ID 通过 https://stats.nba.com/players/ 可以知道,比如 https://stats.nba.com/player/977/ 就是对应着科比的介绍!
# 爬数据
years = [1996, 2012]# 球员职业生涯时间
player_id = '977'# 球员ID
shot_data(years,player_id)

# 可视化投篮图
draw_shot('977')
来感受下进攻万花筒,有很多负角度的

老科,因为他才看了解,喜欢上 NBA的!最早看到蜗壳应该是读小学的时候,同桌柳某的软面抄封面就是 bryant!
5 Others
1)James Harden
# 爬数据
years = [2017, 2019]# 球员职业生涯时间
player_id = '201935'# 球员ID
shot_data(years,player_id)

# 可视化投篮图
draw_shot(player_id)


夜店小王子改邪归正后,没的说,西科东艾北卡南麦四大天王之后,第一分位实至名归(能突能投,欧洲步要哨,后撤步三分都是无解的)!
2)Lebron James
# 爬数据
years = [2017, 2019]# 球员职业生涯时间
player_id = '2544'# 球员ID
shot_data(years,player_id)

# 可视化投篮图
draw_shot(player_id)

老詹还是老詹,全能王,推土机,这是一位哪怕在“敌方阵营”也会让你肃然起敬的球员!
想当初,交易到 Lakers ,我还在朋友圈庆祝我湖终于可以进季后赛了……希望今年能和浓眉哥擦出火花,重返紫金荣耀!
3) Giannis Antetokounmpo

字母哥,这就是个怪兽……期待他的成长!
我还是非常喜欢阿杜的,哈哈,早些年 Kobe 带队打世界级的比赛时,总把阿杜和龙王波什弄混了,哈哈哈,一样的……
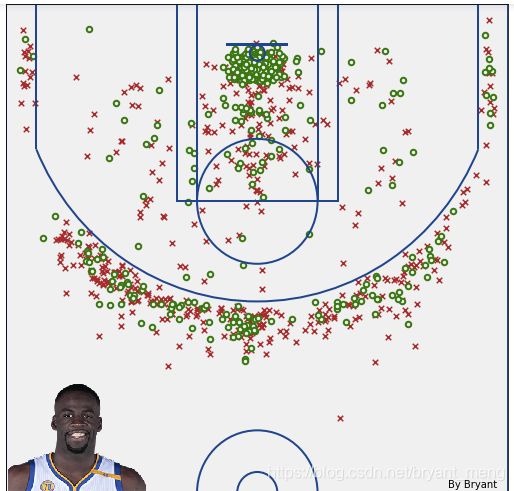
阿杜在勇士的 2 个FMVP没得说,配得上“死神”的称号!只希望伤病不会对阿杜造成太大影响,希望他能在球场上多闪耀几个年华!(中距离跳投无解)
5)Joel Embiid

大帝有三分,而西帝没有,这是最骚的!
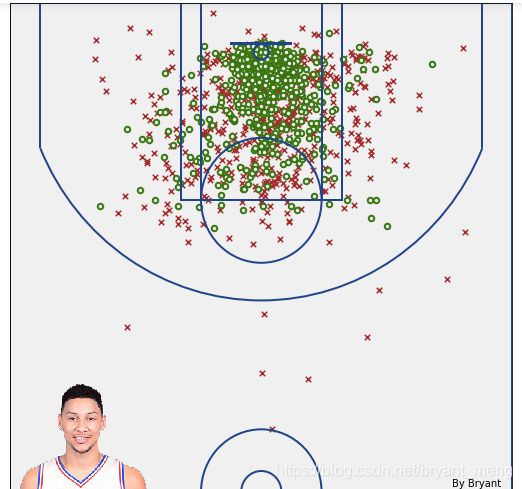
6)Ben Simmons
来看看西帝

哈哈哈,这个定妆照……有点毁形象哈,丢几张图感受一下!


