Win10搭建ELK8.0.0环境
下载
参考官方下载地址。
Elasticsearch
配置
配置文件路径 .\elasticsearch-8.0.0\config\elasticsearch.yml

# 主机 IP,尽量不要使用回环地址,而是要使用私网地址
network.host: 127.0.0.1

# 端口
http.port: 9200

# 禁止下载 Geoip
ingest.geoip.downloader.enabled: false

# 配置跨域
http.cors.enabled: true
http.cors.allow-origin: "*"
启动
运行 .\elasticsearch-8.0.0\bin\elasticsearch.bat 脚本即可。
首次启动会自动配置安全信息:
-> Elasticsearch security features have been automatically configured!
-> Authentication is enabled and cluster connections are encrypted.

->  Password for the elastic user (reset with `bin/elasticsearch-reset-password -u elastic`):
  DycJB*X5KOjHuTq33tIu

->  HTTP CA certificate SHA-256 fingerprint:
  bb5dd53131d6e160892c406dc26e36963a5f8c32aa4c330b1e7b77aeac0ca45a

->  Configure Kibana to use this cluster:
* Run Kibana and click the configuration link in the terminal when Kibana starts.
* Copy the following enrollment token and paste it into Kibana in your browser (valid for the next 30 minutes):
  eyJ2ZXIiOiI4LjAuMCIsImFkciI6WyIxMjcuMC4wLjE6OTIwMCJdLCJmZ3IiOiJiYjVkZDUzMTMxZDZlMTYwODkyYzQwNmRjMjZlMzY5NjNhNWY4YzMyYWE0YzMzMGIxZTdiNzdhZWFjMGNhNDVhIiwia2V5IjoiSC01OVFIOEJhb25naHNKU0x6RE46R0x4NnRLTkpRVUN4VGx0b2d6MVVoUSJ9

->  Configure other nodes to join this cluster:
* On this node:
  - Create an enrollment token with `bin/elasticsearch-create-enrollment-token -s node`.
  - Uncomment the transport.host setting at the end of config/elasticsearch.yml.
  - Restart Elasticsearch.
* On other nodes:
  - Start Elasticsearch with `bin/elasticsearch --enrollment-token `, using the enrollment token that you generated.
在 .\elasticsearch-8.0.0\config\elasticsearch.yml 中自动新增安全配置:
#----------------------- BEGIN SECURITY AUTO CONFIGURATION -----------------------
#
# The following settings, TLS certificates, and keys have been automatically
# generated to configure Elasticsearch security features on 28-02-2022 13:19:01
#
# --------------------------------------------------------------------------------

# Enable security features
xpack.security.enabled: true

xpack.security.enrollment.enabled: true

# Enable encryption for HTTP API client connections, such as Kibana, Logstash, and Agents
xpack.security.http.ssl:
  enabled: true
  keystore.path: certs/http.p12

# Enable encryption and mutual authentication between cluster nodes
xpack.security.transport.ssl:
  enabled: true
  verification_mode: certificate
  keystore.path: certs/transport.p12
  truststore.path: certs/transport.p12
# Create a new cluster with the current node only
# Additional nodes can still join the cluster later
cluster.initial_master_nodes: ["DESKTOP-L24D7IP"]

#----------------------- END SECURITY AUTO CONFIGURATION -------------------------
启动成功:
使用 https 访问 https:127.0.0.1:9200,输入控制台中给出的账号密码:
可以看到启动成功了。 当然,账号密码可以自己设定:
bin/elasticsearch-reset-password -u elasticelasticsearch-head 插件
# github 地址
https://github.com/mobz/elasticsearch-head

# npm 启动方式
git clone git://github.com/mobz/elasticsearch-head.git
cd elasticsearch-head
npm install
npm run start
open http://localhost:9100/
如果遇到安装错误:
npm ERR! code ELIFECYCLE
npm ERR! errno 1
npm ERR! [email protected] install: `node install.js`
npm ERR! Exit status 1
npm ERR!
npm ERR! Failed at the [email protected] install script.
npm ERR! This is probably not a problem with npm. There is likely additional logging output above.
执行忽略脚本安装指令即可:
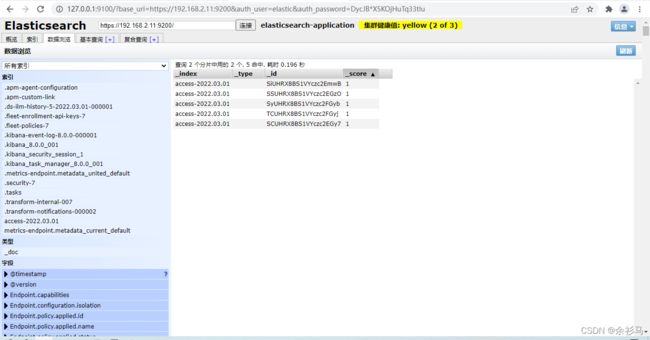
npm install [email protected] --ignore-scripts最终完成启动:
还需要再配置 elasticsearch.yml 实现访问 https:
# 开启权限认证后,es-head-master 访问 es 需要的配置
http.cors.allow-headers: Authorization,X-Requested-With,Content-Length,Content-Typehttp://headIP:9100/?base_uri=https://ESIP:9200&auth_user=elastic&auth_password=yourPwd重置 Logstash 和 Kibana 账号密码
elasticsearch-reset-password -i -u usernameLogstash
配置
# ------------ X-Pack Settings (not applicable for OSS build)--------------
#
# X-Pack Monitoring
# https://www.elastic.co/guide/en/logstash/current/monitoring-logstash.html
xpack.monitoring.enabled: true
xpack.monitoring.elasticsearch.username: logstash_system
xpack.monitoring.elasticsearch.password: logstash_system
#xpack.monitoring.elasticsearch.proxy: ["http://proxy:port"]
xpack.monitoring.elasticsearch.hosts: ["https://192.168.2.11:9200"]
# an alternative to hosts + username/password settings is to use cloud_id/cloud_auth
#xpack.monitoring.elasticsearch.cloud_id: monitoring_cluster_id:xxxxxxxxxx
#xpack.monitoring.elasticsearch.cloud_auth: logstash_system:password
# another authentication alternative is to use an Elasticsearch API key
#xpack.monitoring.elasticsearch.api_key: "id:api_key"
xpack.monitoring.elasticsearch.ssl.certificate_authority: "D:/elasticsearch-8.0.0/config/certs/http_ca.crt"
#xpack.monitoring.elasticsearch.ssl.truststore.path: path/to/file
#xpack.monitoring.elasticsearch.ssl.truststore.password: password
#xpack.monitoring.elasticsearch.ssl.keystore.path: /path/to/file
#xpack.monitoring.elasticsearch.ssl.keystore.password: password
xpack.monitoring.elasticsearch.ssl.verification_mode: certificate
xpack.monitoring.elasticsearch.sniffing: false
#xpack.monitoring.collection.interval: 10s
#xpack.monitoring.collection.pipeline.details.enabled: true
在 config 目录下新建 logstash.conf 作为日志输入输出配置:
# logstash.conf 日志捕获从指定路径的 access.log 文件中获得
# 输出到 es 的 "access-%{+YYYY.MM.dd}" 索引中,索引不存在则自动创建
# 同时考虑到是 https 访问,需要配置 ssl


input {

    file {

        type => "nginx_access"

        path => "D:/testlogs/access.log"

    }

}

output {

    elasticsearch {

        hosts => ["https://192.168.2.11:9200"]

        index => "access-%{+YYYY.MM.dd}"

        user => "logstash_system"

        password => "logstash_system"

        ssl => true

        ssl_certificate_verification => true

        cacert => "D:/elasticsearch-8.0.0/config/certs/http_ca.crt"
    }

    stdout {

        codec => json_lines

    }

}
启动
D:\logstash-8.0.0\bin>logstash -f ../config/logstash.conf在往 access.log 写入数据时,同步到 es :
Kibana
配置
配置文件在 .\kibana-8.0.0\config\kibana.yml
# 注意:IP 地址切勿使用回环地址,应使用私网地址
# SSL 中的 PEM 证书使用 elasticsearch 中的证书

# Kibana is served by a back end server. This setting specifies the port to use.
server.port: 5601

# Specifies the address to which the Kibana server will bind. IP addresses and host names are both valid values.
# The default is 'localhost', which usually means remote machines will not be able to connect.
# To allow connections from remote users, set this parameter to a non-loopback address.
server.host: 192.168.2.11

# The maximum payload size in bytes for incoming server requests.
server.maxPayload: 1048576

# The Kibana server's name. This is used for display purposes.
server.name: "kibaba-host"

# The URLs of the Elasticsearch instances to use for all your queries.
elasticsearch.hosts: ["https://192.168.2.11:9200"]

# If your Elasticsearch is protected with basic authentication, these settings provide
# the username and password that the Kibana server uses to perform maintenance on the Kibana
# index at startup. Your Kibana users still need to authenticate with Elasticsearch, which
# is proxied through the Kibana server.
elasticsearch.username: "kibana_system"
elasticsearch.password: "LO50Eqdeow7v2Q7PVpTb"

# Time in milliseconds to wait for Elasticsearch to respond to pings. Defaults to the value of
# the elasticsearch.requestTimeout setting.
elasticsearch.pingTimeout: 1500

# Time in milliseconds to wait for responses from the back end or Elasticsearch. This value
# must be a positive integer.
elasticsearch.requestTimeout: 30000

# Enables you to specify a path to the PEM file for the certificate
# authority for your Elasticsearch instance.
elasticsearch.ssl.certificateAuthorities: [ "D:/elasticsearch-8.0.0/config/certs/http_ca.crt" ]

# To disregard the validity of SSL certificates, change this setting's value to 'none'.
elasticsearch.ssl.verificationMode: certificate
启动
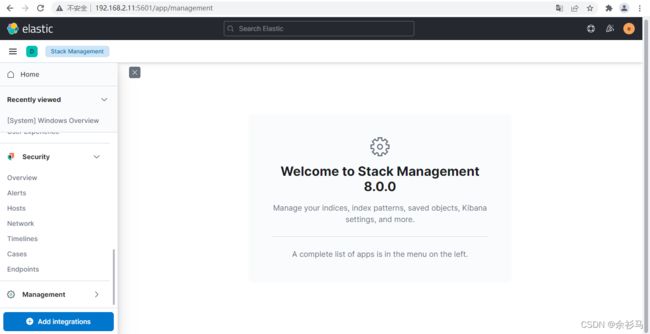
执行 .\kibana-8.0.0\bin\kibana.bat 即可。
访问 http://localhost:5601 时需要输入 elastic 管理员账号密码:
创建数据视图:
management/kibana/dataViews
创建模板为 access-* 的数据视图,自动匹配 access-2022.03.01 索引,不使用时间过滤器。
在 discover 页面就可以使用该数据视图,看到索引里面的数据。


