R语言之探索性数据分析1
首先得把dplyr和ggplot2知识综合起来
如果没有安装tidyverse这个包的话,会出现错误提示
library(tidyverse)
Error in library(tidyverse) : 不存在叫‘tidyverse’这个名字的程辑包
那需要执行下面的代码,下载包,并且加载这个包
install.packages("tidyverse")
library(tidyverse)
那钻石的列子来做可视化分析,要想
检查分类变量的分布,可以使用条形图:
ggplot(data=diamonds)+geom_bar(mapping=aes(x=cut))
运行如下:
 条形的高度表示每个 x 值中观测的数量,可以使用 dplyr::count() 手动计算出这些值:
diamonds %>%
  count(cut)
运行结果
# A tibble: 5 x 2
  cut           n
  <ord>     <int>
1 Fair       1610
2 Good       4906
3 Very Good 12082
4 Premium   13791
5 Ideal     21551
要想检查连续变量的分布,可以使用直方图
ggplot(data = diamonds) +
  geom_histogram(mapping = aes(x = carat), binwidth = 0.5)
运行结果如下:
 可以通过 dplyr::count() 和 ggplot2::cut_width() 函数的组合来手动计算结果
diamonds %>%
  count(cut_width(carat, 0.5))
运行结果如下:
# A tibble: 11 x 2
   `cut_width(carat, 0.5)`     n
   <fct>                   <int>
 1 [-0.25,0.25]              785
 2 (0.25,0.75]             29498
 3 (0.75,1.25]             15977
 4 (1.25,1.75]              5313
 5 (1.75,2.25]              2002
 6 (2.25,2.75]               322
 7 (2.75,3.25]                32
 8 (3.25,3.75]                 5
 9 (3.75,4.25]                 4
10 (4.25,4.75]                 1
11 (4.75,5.25]                 1
例如,如果只考虑重量小于 3 克拉的钻石,并选择一个更小的分箱宽度,那么直方图如下所示:
smaller <- diamonds %>%
  filter(carat < 3)
ggplot(data = smaller, mapping = aes(x = carat)) +
  geom_histogram(binwidth = 0.1)
运行结果如下
 如果想要在同一张图上叠加多个直方图,那么我们建议你使用 geom_freqploy() 函数来代替geom_histogram() 函数geom_freqploy() 可以执行和 geom_histogram() 同样的计算过程,但前者不使用条形来显示计数,而是使用折线。叠加的折线远比叠加的条形更容易理解:
ggplot(data = smaller, mapping = aes(x = carat, color = cut)) +
  geom_freqpoly(binwidth = 0.1)
ggplot(data = smaller, mapping = aes(x = carat)) +
  geom_histogram(binwidth = 0.01)
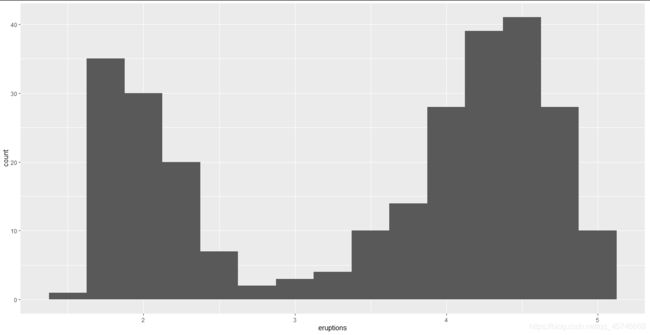
 以下的直方图显示了美国黄石国家公园中的老忠实喷泉的 272 次喷发的时长(单位为分
钟)。喷发时间似乎聚集成了两组:短喷发(2 分钟左右)和长喷发(4~5 分钟),这两组
间几乎没有其他喷发时间:
ggplot(data = faithful, mapping = aes(x = eruptions)) +
  geom_histogram(binwidth = 0.25)
diamonds2 <- diamonds %>%
 filter(between(y, 3, 20))
使用缺失值来代替异常值。最简单的做法就是使用 mutate() 函数创建一个新变量来代替原来的变量。你可以使用 ifelse() 函数将异常值替换为 NA。
diamonds2 <- diamonds %>%
 mutate(y = ifelse(y < 3 | y > 20, NA, y))
ifelse() 函数有 3 个参数。第一个参数 test 应该是一个逻辑向量,如果 test 为 TRUE,函数结果就是第二个参数 yes 的值;如果 test 为 FALSE,函数结果就是第三个参数 no 的值。
ggplot2 在绘图时会忽略缺失值,但会提出警告以通知缺失值被丢弃了
ggplot(data = diamonds2, mapping = aes(x = x, y = y)) +
geom_point()
运行提示警告

Warning message:
Removed 9 rows containing missing values (geom_point)
要想不显示这条警告,可以设置 na.rm = TRUE:
ggplot(data = diamonds2, mapping = aes(x = x, y = y)) +
  geom_point(na.rm = TRUE)
运行结果如下
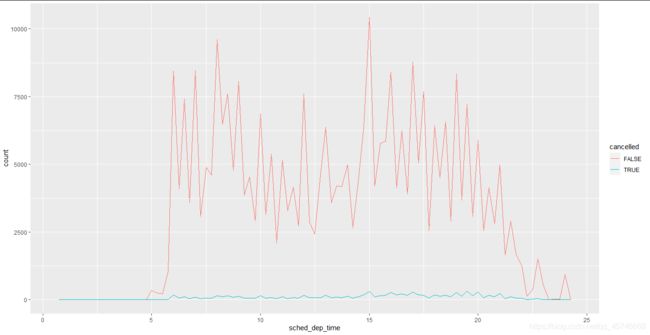
 有时想弄清楚造成有缺失值的观测和没有缺失值的观测间的区别的原因。例如,在nycflights13::flights 中,dep_time 变量中的缺失值表示航班取消了。因此,你应该比较一下已取消航班和未取消航班的计划出发时间。可以使用 is.na() 函数创建一个新变量来完成这个操作:
nycflights13::flights %>%
  mutate(
    cancelled = is.na(dep_time),
    sched_hour = sched_dep_time %/% 100,
    sched_min = sched_dep_time %% 100,
    sched_dep_time = sched_hour + sched_min / 60
  ) %>%
  ggplot(mapping = aes(sched_dep_time)) +
  geom_freqpoly(
    mapping = aes(color = cancelled),
    binwidth = 1/4
  )


