echarts+DataV的用法
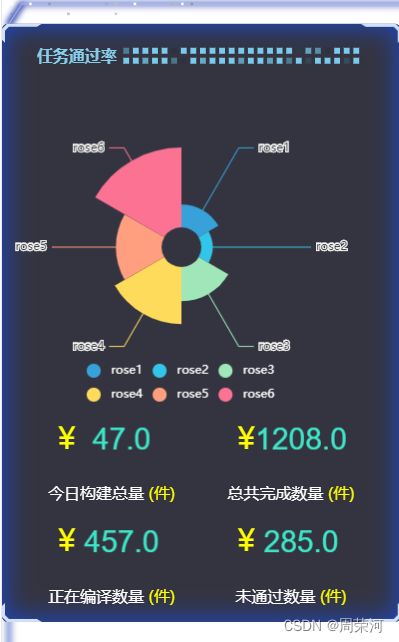
2022.10.20我学会如何使用echarts+DataV的使用。以下是效果图:
目录如下:

一、安装组件库
首先我们先安装组件库。
npm install @jiaminghi/data-view二、main.js引入组件
然后在main.js中引入组件。
// 将自动注册所有组件为全局组件
import dataV from '@jiaminghi/data-view'

Vue.use(dataV)
三、把初始页面作为主页面
我们把HomeView.vue页面作为主页面。
(1)添加全屏容器
先设置全屏容器。
content 使用前请注意将body的margin设为0,否则会引起计算误差,全屏后不能完全充满屏幕。
(2)添加loading加载效果
然后在全屏容器中放入一个loading试一下效果。
       //loading加载中
      Loading...
(3)添加边框
然后就是添加边框。
       //loading加载中
      Loading...

       //添加边框
做到这边的效果为

loading我就没展示了。
然后可以给loading一个条件渲染,就是在加载之后可以显示出这个页面。
给loading一个v-if=”loading“,边框为else,然后data数据里面填loading=true,添加mounted页面加载后的方法。
Loading...
// 页面加载后
mounted(){
// 执行这个方法
this.guanbiLoading();
},
data() {
return {
// loading默认打开
loading: true,
};
},
然后在methods中调用这个方法。
methods: {
// mounted执行后调用的方法
guanbiLoading(){
// setTimeout()指定时间后调用的函数,时间为3000毫秒
setTimeout(()=>{
this.loading = false;
},1000)
}
},
具体就是在指定事件之后关闭这个loading。
(4)创建一个新的vue页面
可以让它用一个边框包裹住,里面的展示方法类似于
(5)注册引入这个页面
// 引入组件
import zuo from './zuo.vue'
components:{
zuo
},
这样等一下在新的vue页面中的效果就可以在
(6)编写新的vue页面代码
echarts的编写需要在components中写(相当于子组件),views是用来展示这个效果的(相当于父组件)
我们在view中创建新的页面。因为是用来展示echarts的,所以代码直接上。
任务通过率
{{ item.text }}
(件)
这边引入的组件是components子组件里面的内容。所以总共需要引入两次组件(view => 主页main )(components => view)
(7)编写components建立新页面
这里面要注意的几点是建立DOM容器,然后获取id,都是mounted页面加载之后显示出这个页面的效果。echartsMinis的样式我在后面会放出来。
(8)完整代码
.1主页面
// 主页面
Loading...
.2view 下的新页面
任务通过率
{{ item.text }}
(件)
.3components下的新页面
.4 units.js文件
1)index.js文件
export function debounce(func, wait, immediate) {
let timeout, args, context, timestamp, result;
const later = function() {
// 据上一次触发时间间隔
const last = +new Date() - timestamp;
// 上次被包装函数被调用时间间隔 last 小于设定时间间隔 wait
if (last < wait && last > 0) {
timeout = setTimeout(later, wait - last);
} else {
timeout = null;
// 如果设定为immediate===true,因为开始边界已经调用过了此处无需调用
if (!immediate) {
result = func.apply(context, args);
if (!timeout) context = args = null;
}
}
};
return function(...args) {
context = this;
timestamp = +new Date();
const callNow = immediate && !timeout;
// 如果延时不存在,重新设定延时
if (!timeout) timeout = setTimeout(later, wait);
if (callNow) {
result = func.apply(context, args);
context = args = null;
}
return result;
};
}
2)resizeMixins.js文件
// 混入代码 resize-mixins.js
import { debounce } from '@/utils/index';
const resizeChartMethod = '$__resizeChartMethod';
export default {
data() {
// 在组件内部将图表init的引用映射到chart属性上
return {
chart: null,
};
},
created() {
window.addEventListener('resize', this[resizeChartMethod], false);
},
beforeDestroy() {
window.removeEventListener('reisze', this[resizeChartMethod]);
},
methods: {
// 通过lodash的防抖函数来控制resize的频率
[resizeChartMethod]: debounce(function() {
if (this.chart) {
this.chart.resize();
}
}, 100),
},
};
.5main.js文件
import Vue from 'vue'
import App from './App.vue'
import router from './router'
import store from './store'
import axios from 'axios'
import dataV from '@jiaminghi/data-view'
//引入echart
import * as echarts from 'echarts'
Vue.prototype.$echarts = echarts
Vue.use(dataV)
Vue.prototype.$ajax= axios
Vue.config.productionTip = false
new Vue({
router,
store,
axios,
render: function (h) { return h(App) }
}).$mount('#app')