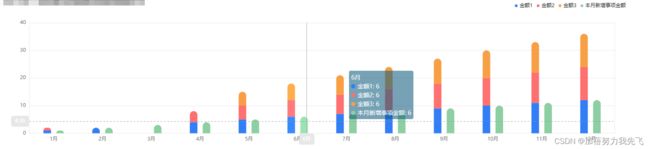
echarts柱状图堆叠和不堆叠-放在一起
<div id="average-score1" class="risk-percent" />
import * as echarts from "echarts";
averageBusinessScore1() {
      let unsolvedAmountArr = [1, 2, 0, 4, 5, 6, 7, 8, 9, 10, 11, 12];
      let solvedAmountArr = [1, 0, 0, 4, 5, 6, 7, 8, 9, 10, 11, 12];
      let overAmountArr = [0, 0, 0, 0, 5, 6, 7, 8, 9, 10, 11, 12];
      let solvedQuantityArr = [1, 2, 3, 4, 5, 6, 7, 8, 9, 10, 11, 12];

      var data1 = [320, 600, 901, 934, 1290, 1330, 1320];
      var data2 = [430, 182, 191, 234, 290, 250, 310];
      var data3 = [150, 212, 201, 154, 190, 300, 0];
      for (var i = 0; i < overAmountArr.length; i++) {
        if (overAmountArr[i] == 0) {
          if (solvedAmountArr[i] == 0) {
            unsolvedAmountArr[i] = {
              value: unsolvedAmountArr[i],
              itemStyle: {
                barBorderRadius: [30, 30, 0, 0],
              },
            };
          } else {
            solvedAmountArr[i] = {
              value: solvedAmountArr[i],
              itemStyle: {
                barBorderRadius: [30, 30, 0, 0],
              },
            };
          }
        } else {
          overAmountArr[i] = {
            value: overAmountArr[i],
            itemStyle: {
              barBorderRadius: [30, 30, 0, 0],
            },
          };
        }
      }

      var elementById = document.getElementById("average-score1");
      var myChart = echarts.init(elementById);
      myChart.setOption({
        tooltip: {
          trigger: "axis",
          axisPointer: {
            type: "cross",
            crossStyle: {
              color: "#999",
            },
          },
          backgroundColor: "rgba(16,92,125,0.57)",
          borderColor: "rgba(204,204,204,0)",
          textStyle: {
            color: "#fff",
          },
        },
        grid: {
          top: "15%",
          left: "4%",
          right: "4%",
          bottom: "8%",
          containLabel: true,
        },
        legend: {
          orient: "horizontal",
          show: true,
          type: "plain",
          right: "2%",
          top: "1%",
          selectedMode: false,
          itemHeight: 6,
          itemWidth: 6,
          textStyle: {
            // color: '#fff',
            // fontWeight: 600
          },
        },
        xAxis: [
          {
            type: "category",
            data: [
              "1月",
              "2月",
              "3月",
              "4月",
              "5月",
              "6月",
              "7月",
              "8月",
              "9月",
              "10月",
              "11月",
              "12月",
            ],
            axisLine: {
              show: true,
              lineStyle: {
                color: "#e8e8e8",
                width: 1,
              },
            },
            axisLabel: {
              color: "#737373",
            },
            axisTick: {
              show: false,
            },
            splitLine: {
              show: false,
              lineStyle: {
                color: "#BFD4F1",
              },
            },
          },
        ],
        yAxis: [
          {
            type: "value",
            name: "",
            // splitLine: {
            //   show: true,
            //   lineStyle: {
            //     type: 'dashed',
            //     interval: 1,
            //     opacity: 0.5,
            //     color: '#04bbff'
            //   }
            // },
            splitLine: {
              show: true,
              lineStyle: {
                interval: 1,
                color: "#e8e8e8",
              },
            },
            axisLabel: {
              color: "#737373",
              // show: false,
              // formatter: '{value} ml'
            },
            axisLine: {
              show: true,
              lineStyle: {
                color: "#e8e8e8",
                width: 1,
              },
            },
            axisTick: {
              show: false,
            },
          },
          {
            type: "value",
            name: "",
            splitLine: {
              show: false,
              lineStyle: {
                interval: 1,
                color: "#BFD4F1",
              },
            },
            axisLabel: {
              color: "#737373",
              // show: false,
              // formatter: '{value} °C'
            },
            axisLine: {
              show: true,
              lineStyle: {
                color: "#e8e8e8",
                width: 1,
              },
            },
            axisTick: {
              show: false,
            },
          },
        ],
        series: [
          {
            // name: "已化解金额",
            name: "金额1",
            type: "bar",
            stack: "Ad", //堆叠
            barWidth: 18,
            barGap: "70%",
            itemStyle: {
              color: "#327ef7",
            },
            data: unsolvedAmountArr,
          },
          {
            // name: "未化解金额",
            name: "金额2",
            type: "bar",
            stack: "Ad",
            barWidth: 18,
            itemStyle: {
              color: "#ff7070",
            },
            data: solvedAmountArr,
          },
          {
            // name: "超目标化解金额",
            name: "金额3",
            type: "bar",
            stack: "Ad",
            barWidth: 18,
            itemStyle: {
              color: "#f89f46",
              barBorderRadius: [30, 30, 0, 0],
            },
            data: overAmountArr,
          },
          {
            name: "本月新增事项金额",
            type: "bar",
            barWidth: 18,
            barGap: "70%",
            itemStyle: {
              color: "#8dcfa3",
              barBorderRadius: [30, 30, 0, 0],
            },
            data: solvedQuantityArr,
          },
        ],
      });
    },