数据架构设计 数据架构组
介绍 (Introduction)
Within a company using data to derive business value, although you may not be appreciated with your data science skills all the time, you always are when you manage the data infrastructure well. Everyone wants the data stored in an accessible location, cleaned up well, and updated regularly.
在使用数据获取业务价值的公司中,尽管您可能不会一直以数据科学技能为荣,但始终可以很好地管理数据基础架构。 每个人都希望将数据存储在可访问的位置,妥善清理并定期更新。
Backed up by these unobtrusive but steady demands, the salary of a data architect is equally high or even higher than that of a data scientist. In fact, based on the salary research conducted by PayScale (https://www.payscale.com/research/US/Country=United_States/Salary) shows the US average salary of Data Architect is $121,816, while that of Data Scientist is $96,089.
在这些低调但稳定的需求的支持下,数据架构师的薪水与数据科学家的薪资同样高,甚至更高。 实际上,根据PayScale进行的薪酬研究( https://www.payscale.com/research/US/Country=United_States/Salary ),美国数据架构师的平均工资为121,816美元 ,而数据科学家的平均工资为96,089 美元。 。
Not to say all data scientists should change their job, there would be a lot of benefits for us to learn at least the fundamentals of data architecture. Actually, there is one simple (but meaningful) framework that will help you understand any kinds of real-world data architectures.
并不是说所有数据科学家都应该换工作,至少了解数据架构的基础知识对我们会有很多好处。 实际上,有一个简单(但有意义)的框架可以帮助您了解各种现实世界的数据体系结构。
目录 (Table of Contents)
Three Components in Data Architecture: Data Lake -> Data Warehouse -> Data Mart
数据架构中的三个组件:Data Lake-> Data Warehouse-> Data Mart
Tools Used in Each Component
每个组件中使用的工具
Case Study — Building Scheduled & Automatic Data Feed from BigQuery (Data Warehouse) to Google Sheets (Data Mart)
案例研究—构建从BigQuery(数据仓库)到Google Sheets(数据集市)的计划和自动数据馈送
Ending Note
尾注
数据架构中的三个组件:Data Lake-> Data Warehouse-> Data Mart (Three Components in Data Architecture: Data Lake -> Data Warehouse -> Data Mart)
“Data Lake”, “Data Warehouse”, and “Data Mart” are typical components in the architecture of data platform. In this order, data produced in the business is processed and set to create another data implication.
“数据湖”,“数据仓库”和“数据集市”是数据平台体系结构中的典型组件。 按照此顺序,将处理业务中产生的数据并将其设置为创建另一个数据含义。

Three components take responsibility for three different functionalities as such:
三个组件负责三种不同的功能,例如:
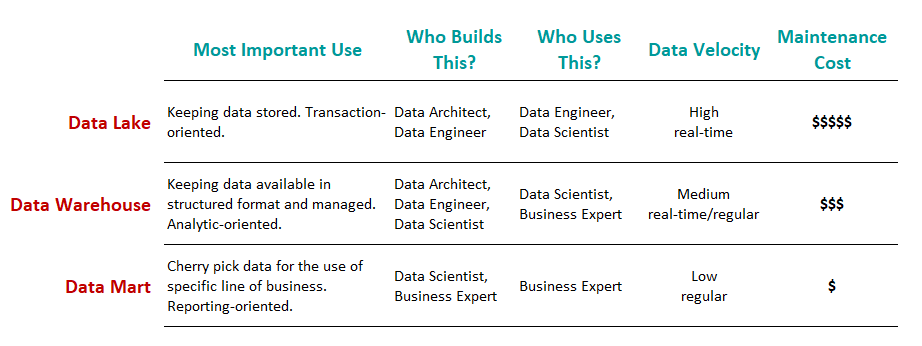
Data Lake: holds an original copy of data produced in the business. Data processing from the original should be minimal if any; otherwise in case some data processing turned out to be wrong in the end, it will not be possible to fix the error retrospectively.
Data Lake :持有业务中产生的数据的原始副本。 如果有的话,原始数据的处理应该最少。 否则,如果最终发现某些数据处理错误,将无法追溯修复该错误。
Data Warehouse: holds data processed and structured by a managed data model, reflecting the global (not specific) direction of the final use of the data. In many cases, the data is in tabular format.
数据仓库 :保存由托管数据模型处理和构造的数据,反映最终使用数据的全局(非特定)方向。 在许多情况下,数据采用表格格式。
Data Mart: holds a subpart and/or aggregated data set for the use of a particular business function, e.g. specific business unit or specific geographical area. A typical example is when we prepare the summary of KPIs for a specific business line followed by visualization in BI tool. Especially, preparing this kind of separate and independent component after the warehouse is worthwhile when the user wants the data mart regularly and frequently updated. On contrary, this portion can be skipped in cases the user only wants some set of data for ad hoc analysis done only once.
数据集市 :保存用于特定业务功能(例如特定业务部门或特定地理区域)的子数据集和/或聚合数据集。 一个典型的例子是,当我们准备针对特定业务线的KPI摘要时,然后在BI工具中进行可视化。 特别是,当用户希望定期且频繁地更新数据集市时,在仓库后准备这种独立的组件是值得的。 相反,如果用户只希望某些数据组进行一次即席分析,则可以跳过此部分。
For more real-world examples beyond this bare-bone-only description, enjoy googling “data architecture” to find a lot of data architecture diagrams.
有关除仅裸机描述之外的更多实际示例,请使用Google搜索“数据架构”以查找大量数据架构图。
为什么我们需要分为这三个部分? (Why do we need to split into these three components?)
Because different stages within the process have different requirements.
因为过程中的不同阶段有不同的要求。
In the data lake stage, we want the data is close to the original, while the data warehouse is meant to keep the data sets more structured, manageable with a clear maintenance plan, and having clear ownership. In the data warehouse, we also like the database type to be analytic-oriented rather than transaction-oriented. On the other hand, data mart should have easy access to non-tech people who are likely to use the final outputs of data journeys.
在数据湖阶段,我们希望数据接近原始数据,而数据仓库的目的是通过清晰的维护计划使数据集更结构化,可管理并拥有明确的所有权。 在数据仓库中,我们还希望数据库类型面向分析而不是面向事务。 另一方面,数据集市应该可以方便地访问可能使用数据旅程最终输出的非技术人员。
Differently-purposed system components tend to have re-design at separate times. Then, configuring the components loosely-connected has the advantage in future maintenance and scale-up.
不同用途的系统组件往往在不同的时间进行重新设计。 然后,配置松散连接的组件在将来的维护和扩大规模方面具有优势。
数据工程师和数据科学家如何处理这三个组成部分? (How do data engineers and data scientists work to these three components?)
Roughly speaking, data engineers cover from data extraction produced in business to the data lake and data model building in data warehouse as well as establishing ETL pipeline; while data scientists cover from data extraction out of data warehouse, building data mart, and to lead to further business application and value creation.
粗略地说,数据工程师涵盖了从业务中提取的数据到数据湖,在数据仓库中建立数据模型以及建立ETL管道的过程。 而数据科学家则负责从数据仓库中提取数据,构建数据集市,并导致进一步的业务应用和价值创造。
Of course, this role assignment between data engineers and data scientists is somewhat ideal and many companies do not hire both just to fit this definition. Actually, their job descriptions tend to overlap.
当然,数据工程师和数据科学家之间的这种角色分配有些理想,并且许多公司都不只是为了符合此定义而聘用两者。 实际上,他们的工作描述往往会重叠。
三要素法之外的新趋势 (New trend beyond the three-component approach)
Last but not the least, it should be worth noting that this three-component approach is conventional one present for longer than two decades, and new technology arrives all the time. For example, “Data Virtualization” is an idea to allow one-stop data management and manipulation interface against data sources, regardless of their formats and physical locations.
最后但并非最不重要的一点是,值得注意的是,这种由三部分组成的方法是存在超过二十年的传统方法,并且新技术一直在不断出现。 例如, “ 数据虚拟化 ”的想法是允许针对数据源的一站式数据管理和操作界面,而不管其格式和物理位置如何。
每个组件中使用的工具 (Tools Used in Each Component)
Now, we understood the concept of three data platform components. Then, what tools do people use? Based on this “Data Platform Guide” (in Japanese) , here’re some ideas:
现在,我们了解了三个数据平台组件的概念。 然后,人们使用什么工具? 根据此“数据平台指南” (日语),这里有一些想法:
数据湖/仓库 (Data lake/warehouse)
There are the following options for data lake and data warehouse.
数据湖和数据仓库有以下选项。

ETL工具 (ETL tools)
ETL happens where data comes to the data lake and to be processed to fit the data warehouse. Data arrives in real-time, and thus ETL prefers event-driven messaging tools.
ETL发生在数据到达数据湖并进行处理以适合数据仓库的地方。 数据是实时到达的,因此ETL更喜欢事件驱动的消息传递工具。
工作流程引擎 (Workflow engine)
A workflow engine is used to manage the overall pipelining of the data, for example, visualization of where the process is in progress by a flow chart, triggering automatic retry in case of error, etc.
工作流引擎用于管理数据的整体流水线,例如,通过流程图可视化流程在何处进行,在出现错误的情况下触发自动重试等。
数据集市/ BI工具 (Data mart/BI tools)
The following tools can be used as data mart and/or BI solutions. The choice will be dependent on the business context, what tools your company is familiar with (e.g. are you Tableau person or Power BI person?), the size of aggregated data (e.g. if the data size is small, why doesn’t the basic solution like Excel or Google Sheets meet the goal?), what data warehouse solution do you use (e.g. if your data warehouse is on BigQuery, Google DataStudio can be an easy solution because it has natural linkage within the Google circle), and etc.
以下工具可用作数据集市和/或BI解决方案。 选择将取决于业务背景,贵公司熟悉哪些工具(例如,您是Tableau人员还是Power BI人员?),聚合数据的大小(例如,如果数据大小很小,为什么基本不Excel或Google Sheets之类的解决方案是否达到了目标?),您使用什么数据仓库解决方案(例如,如果您的数据仓库位于BigQuery上,则Google DataStudio会是一个简单的解决方案,因为它在Google圈子中具有自然的联系)。

案例研究—构建从BigQuery(数据仓库)到Google Sheets(数据集市)的计划和自动数据馈送 (Case Study — Building Scheduled & Automatic Data Feed from BigQuery (Data Warehouse) to Google Sheets (Data Mart))
When the data size stays around or less than tens of megabytes and there is no dependency on other large data set, it is fine to stick to spreadsheet-based tools to store, process, and visualize the data because it is less-costly and everyone can use it.
当数据大小保持在数十兆字节左右或小于数十兆字节并且不依赖于其他大型数据集时,可以坚持使用基于电子表格的工具来存储,处理和可视化数据,因为它的成本更低,而且每个人可以使用它。
Once the data gets larger and starts having data dependency with other data tables, it is beneficial to start from cloud storage as a one-stop data warehouse. (When the data gets even larger to dozens of terabytes, it can make sense to use on-premise solutions for cost-efficiency and manageability.)
一旦数据变大并开始与其他数据表具有数据依存关系,从云存储作为一站式数据仓库开始是有益的。 (当数据变得更大到数十兆字节时,使用本地解决方案可以提高成本效益和可管理性。)
In this chapter, I will demonstrate a case when the data is stored in Google BigQuery as a data warehouse. BigQuery data is processed and stored in real-time or in a short frequency. The end-user still wants to see daily KPIs on a spreadsheet on a highly aggregated basis. This means data mart can be small and fits even the spreadsheet solution. Instead of Excel, let’s use Google Sheets here because it can be in the same environment as the data source in BigQuery. Oh, by the way, do not think about running the query manually every day. Try to find a solution to make everything running automatically without any action from your side.
在本章中,我将演示一种将数据作为数据仓库存储在Google BigQuery中的情况。 BigQuery数据会实时或以较短的频率进行处理和存储。 最终用户仍然希望以高度汇总的方式在电子表格上查看每日KPI。 这意味着数据集市可能很小,甚至适合电子表格解决方案 。 让我们在这里使用Google表格 ,而不是Excel,因为它可以与BigQuery中的数据源处于同一环境中。 哦,顺便说一句,不要考虑每天手动运行查询。 尝试找到一种解决方案,使所有内容自动运行,而无需您采取任何措施。
本案例研究中要使用的数据 (Data to be used in this case study)
In this case study, I am going to use a sample table data which has records of NY taxi passengers per ride, including the following data fields:
在本案例研究中,我将使用一个样本表数据,该数据具有每次乘车纽约出租车乘客的记录,包括以下数据字段:
- Car ID 车号
- Driver ID 驱动程序ID
- Date of ride 乘车日期
- Number of passengers 乘客人数
- Amount of fare 车费金额
- etc. 等等
The sample data is stored in the BigQuery as a data warehouse.
样本数据作为数据仓库存储在BigQuery中。
Google表格可以从BigQuery表中提取数据吗? (Can Google Sheets pull data from BigQuery tables?)
Technically yes, but at the moment this is only available through Connected Sheets and you need an account of G Suite Enterprise, Enterprise for Education, or G Suite Enterprise Essentials account.
从技术上讲是可以的,但是目前只能通过Connected Sheets使用,并且您需要一个G Suite Enterprise帐户,一个Enterprise for Education帐户或G Suite Enterprise Essentials帐户 。

Connected Sheets allows the user to manipulate BigQuery table data almost as if they play it on spreadsheet. See the GIF demonstration in this page on “BenCollins” blog post.
Connected Sheets允许用户操作BigQuery表数据,就像在电子表格上播放它们一样。 请参阅本页面“ BenCollins”博客文章上的GIF演示。
Connected Sheets also allows automatic scheduling and refresh of the sheets, which is a natural demand as a data mart.
Connected Sheets还允许自动调度和刷新工作表 ,这是作为数据集市的自然需求。
Although it demonstrates itself as a great option, one possible issue is that owing G Suite account is not very common.
尽管它证明自己是一个不错的选择,但一个可能的问题是,欠缺G Suite帐户并不常见。
For more details about the setups, see this blog post from “BenCollins”.
有关设置的更多详细信息,请参阅“ BenCollins”中的此博客文章 。
我们该怎么做才能将数据从BigQuery推送到Google表格? (What can we do to push data from BigQuery to Google Sheets?)
To extract data from BigQuery and push it to Google Sheets, BigQuery alone is not enough, and we need a help of server functionality to call the API to post a query to BigQuery, receive the data, and pass it to Google Sheets.
要从BigQuery提取数据并将其推送到Google表格,仅靠BigQuery是不够的,我们需要服务器功能的帮助来调用API以将查询发布到BigQuery,接收数据并将其传递给Google表格。
The server functionality can be on a server machine, external or internal of GCP (e.g. ‘Compute Engine’ instance on GCP; or ‘EC2’ instance on AWS). The code run can be scheduled using unix-cron job. But one downside here is that it takes maintenance work and cost on the instance and is too much for a small program to run.
服务器功能可以在GCP外部或内部的服务器计算机上(例如,GCP上的“ Compute Engine”实例;或AWS上的“ EC2”实例)。 可以使用unix-cron job调度代码运行。 但是这里的一个缺点是,它花费了实例的维护工作和成本,并且对于一个小的程序而言,太多了。
‘Google Cloud Functions’ is a so-called “serverless” solution to run code without the launch of a server machine. Putting code in Cloud Functions and setting a trigger event (e.g. scheduled timing in this case study, but also can be HTML request from some internet users), GCP automatically manages the run of the code.
“ Google Cloud Functions”是所谓的“无服务器”解决方案,用于在不启动服务器计算机的情况下运行代码。 将代码放入Cloud Functions并设置触发事件(例如,在本案例研究中为预定时间,但也可以是某些互联网用户HTML请求),GCP会自动管理代码的运行。
我的案例研究中的设置 (Set-ups in my case study)
There are two steps in the configuration of my case study using NY taxi data.
使用纽约出租车数据配置我的案例研究需要两个步骤。
Step 1: Set up scheduling — set Cloud Scheduler and Pub/Sub to trigger a Cloud Function.
步骤1:设置计划-设置Cloud Scheduler和Pub / Sub以触发Cloud Function。
Here, “Pub/Sub” is a messaging service to be subscribed by Cloud Functions and to trigger its run every day at a certain time. “Cloud Scheduler” is functionality to kick off something with user-defined frequency based on unix-cron format. Combining these two, we can create regular messages to be subscribed by Cloud Function. See this official instruction on how to do it. Here are screenshots from my GCP set-up.
在这里,“发布/订阅”是一项消息服务,将由Cloud Functions订阅,并在每天的特定时间触发其运行。 “ Cloud Scheduler”是一种功能,它可以根据unix-cron格式以用户定义的频率启动某些程序。 结合这两者,我们可以创建常规消息以供Cloud Function订阅。 有关如何执行的信息 ,请参见此官方说明 。 这是我的GCP设置中的屏幕截图。


Step 2: Set up code — prepare code on Cloud Functions to query BigQuery table and push it to Google Sheets.
第2步:设置代码-在Cloud Functions上准备代码以查询BigQuery表并将其推送到Google表格。
The next step is to set up Cloud Functions. In Cloud Functions, you define 1) what is the trigger (in this case study, “cron-topic” sent from Pub/Sub, linked to Cloud Scheduler which pulls the trigger every 6 am in the morning) and 2) the code you want to run when the trigger is detected.
下一步是设置云功能。 在Cloud Functions中,您定义1)触发器是什么(在本案例研究中,是从Pub / Sub发送的“ cron-topic”,链接到Cloud Scheduler,该触发器每隔早上6点拉动触发器),并且2)代码是要在检测到触发器时运行。
See this official instruction for further details, and here are screenshots from my set-up.
有关更多详细信息,请参见此官方说明,以下是我设置的屏幕截图。
The code to run has to be enclosed in a function named whatever you like (“nytaxi_pubsub” in my case.) The code content consists of two parts: part 1 to run a query on BigQuery to reduce the original BigQuery table to KPIs and save it as another data table in BigQuery, as well as make it a Pandas data frame, and part 2 to push the data frame to Sheets.
要运行的代码必须包含在一个您喜欢的函数中(在我的情况下为“ nytaxi_pubsub”。)代码内容包括两部分:第一部分:在BigQuery上运行查询以将原始BigQuery表简化为KPI并保存它作为BigQuery中的另一个数据表,并使其成为Pandas数据框架,第2部分将数据框架推入Sheets。
Here’re the codes I actually used. Importantly, the authentication to BigQuery is automatic as long as it resides within the same GCP project as Cloud Function (see this page for explanation.) Yet, this is not the case about the Google Sheets, which needs at least a procedure to share the target sheet through Service Account. See the description in gspread library for more details.
这是我实际使用的代码。 重要的是,只要BigQuery与Cloud Function位于同一GCP项目中,它就会自动进行身份验证(请参阅此页面以获取说明。)但是,对于Google表格而言,情况并非如此,它至少需要一个过程来共享服务帐户访问目标表。 有关更多详细信息,请参见gspread库中的描述 。
import os
import google.auth
from google.cloud import bigquery
from google.cloud import bigquery_storage_v1beta1
import datetime
import gspread
import urllib.request
from oauth2client.service_account import ServiceAccountCredentials


def nytaxi_pubsub(event, context):


    # 1st. Part - Run query upon data warehouse BigQuery table, create data mart BigQuery table, and create pandas data frame with the same contents.


    today = datetime.date.today().strftime('%Y%m%d')


    # Explicitly create a credentials object. This allows you to use the same
    # credentials for both the BigQuery and BigQuery Storage clients, avoiding
    # unnecessary API calls to fetch duplicate authentication tokens.
    credentials, project_id = google.auth.default(
        scopes=["https://www.googleapis.com/auth/cloud-platform"]
    )


    # Instantiate bigquery client and bigquery_storage client for the project.
    client = bigquery.Client(project=project_id)
    bqstorageclient = bigquery_storage_v1beta1.BigQueryStorageClient()


    # Define query to run.
    query = f"""
        SELECT
            {today} AS date
            , passenger_count
            , COUNT(*) AS ride_count
            , SUM(passenger_count) AS total_passenger_count
            , SUM(fare_amount) AS total_fare_amount
            , SUM(tip_amount) AS total_tip_amount
            , SUM(total_amount) AS total_amount
        FROM < Original NY taxi data table in BigQuery >
        --WHERE ride_month = {today}
        GROUP BY passenger_count
        ORDER BY passenger_count
    """


    # Define BigQuery destination table.
    destination_dataset = 'DataMart_NYTaxi_per_customer'
    destination_table = f"{project_id}.{destination_dataset}.DataMart_NYTaxi_per_customer_{today}"


    ## Delete if there's already a table as the target table.
    client.delete_table(destination_table, not_found_ok=True)


    # Run query upon data warehouse BigQuery table, create data mart BigQuery table, and create pandas data frame with the same contents.
    query_job = client.query(query, job_config=bigquery.QueryJobConfig(destination=destination_table))
    res_df = query_job.result().to_dataframe(bqstorage_client=bqstorageclient)


    # 2nd. Part - Load the data frame to Google Sheets


    # Instantiate Sheets service account client - Beforehand, create service account json and save it somewhere in GCP Storage.
    if not os.path.isfile('/tmp/service_account.json'):
        urllib.request.urlretrieve("< Path to .json with service account credentials stored in GCP Storage>","/tmp/service_account.json")


    client = gspread.service_account(filename='/tmp/service_account.json')


    sheet = client.open("DataMart_NYTaxi_per_customer").sheet1


    # Only when the Google Sheets file is new.
    # sheet.update([res_df.columns.values.tolist()] + res_df.values.tolist())


    # When Google Sheets file already has some input.
    sheet.insert_rows(res_df.values.tolist(),2)
google-auth==1.20.1
google-cloud-bigquery==1.27.2
google-cloud-bigquery-storage==1.0.0
oauth2client==4.1.3
pandas==0.25.3
pandas-gbq==0.13.2
gspread==3.6.0
urllib3==1.24.3Google表格上的最终数据集市 (Final data mart on Google Sheets)
Finally, I got the aggregated data in Google Sheets like this:
最后,我在Google表格中获得了汇总数据,如下所示:

This sheet is automatically updated every morning, and as the data warehouse is receiving new data through ETL from the data lake, we can easily keep track of the NY taxi KPIs the first thing every morning.
该表每天早晨自动更新,并且数据仓库正在通过ETL从数据湖接收新数据时,我们可以每天第一天轻松地跟踪NY出租车KPI。
尾注 (Ending Note)
In a large company who hires data engineers and/or data architects along with data scientists, a primary role of data scientists is not necessarily to prepare the data infrastructure and put it in place, but knowing at least getting the gist of data architecture will benefit well to understand where we stand in the daily works.
在一家雇用数据工程师和/或数据架构师以及数据科学家的大公司中,数据科学家的主要作用不一定是准备数据基础架构并将其部署到位,但是至少了解数据架构要点将是有益的很了解我们在日常工作中的立场。
Data Lake -> Data Warehouse -> Data Mart is a typical platform framework to process the data from the origin to the use case. Separating the process into three system components has many benefits for maintenance and purposefulness.
Data Lake-> Data Warehouse-> Data Mart是一个典型的平台框架,用于处理从源到用例的数据。 将过程分为三个系统组件对于维护和目标性有很多好处。
There are many options in the choice of tools. They are to be wisely selected against the data environment (size, type, and etc.) and the goal of the business.
工具的选择有很多选择。 应根据数据环境(大小,类型等)和业务目标明智地选择它们。
Finally in this post, I discussed a case study where we prepared a small size data mart on Google Sheets, pulling out data from BigQuery as a data warehouse. With the use of Cloud Scheduler and Pub/Sub, the update was made to be automatic.
最后,在本文中,我讨论了一个案例研究,我们在Google Sheets上准备了一个小型数据集市,从BigQuery中提取数据作为数据仓库。 通过使用Cloud Scheduler和Pub / Sub,更新已自动完成。
翻译自: https://towardsdatascience.com/fundamentals-of-data-architecture-to-help-data-scientists-understand-architectural-diagrams-better-7bd26de41c66
数据架构设计 数据架构组