JVM 内存结构
一、程序计数器
1.1 定义
当前线程所执行的字节码的行号指示器,用于记住下一条 jvm 的执行地址。
1.2 特点
1、线程私有
2、不存在内存溢出
二、虚拟机栈
2.1 定义
每个线程运行时所需要的内存,称为虚拟机栈。
2.2 特点
1、每个栈由多个栈帧(Frame)组成,对应着每次方法调用时所占用的内存。
2、每个线程只能有一个活动栈帧,对应着当前正在执行的那个方法。
2.3 问题辨析
2.3.1 垃圾回收是否涉及栈内存
不涉及,因为方法执行完毕后,内存就被回收了。
2.3.2 栈内存分配是否越大越好
不是,它和物理内存有关,假设当前物理内存为 500M,栈的内存为 1M,那么他就可以存放 500 个线程,如果此时增加栈内存为 2M,那么此时就只能存放 250 个线程了,所以不是越大越好。
2.3.3 方法内的局部变量是否线程安全
看情况,如果方法内局部变量没有逃离方法的作用访问,它是线程安全的。如果是局部变量引用了对象,并逃离方法的作用范围,需要考虑线程安全。
2.4 栈内存溢出
2.4.1 栈帧过多导致内存溢出
方法的连续调用且无法释放资源,即栈帧都被加载到虚拟机栈里面,就会出现虚拟机栈的栈帧过多导致内存溢出的情况。比如下面的代码就会导致内存溢出
// 递归调用,方法一直调用自己就会导致栈内存溢出,打印 count 来记录到底递归了多少次
public class Demo1_2 {
    private static int count;

    public static void main(String[] args) {
        try {
            method1();
        } catch (Throwable e) {
            e.printStackTrace();
            System.out.println(count);
        }
    }
    private static void method1() {
        count++;
        method1();
    }
}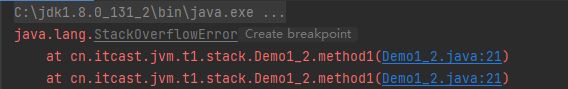
2.4.2 栈帧过大导致内存溢出
如果栈帧特别的大,把我的虚拟机栈给撑满了也会导致内存溢出, 不过这种情况很少见。
2.5 线程运行诊断
2.5.1 cpu 占用过高
首先在 linux 环境里面运行一段代码,如下所示:
public class Demo1_16 {

    public static void main(String[] args) {
        new Thread(null, () -> {
            System.out.println("1...");
            while(true) {

            }
        }, "thread1").start();


        new Thread(null, () -> {
            System.out.println("2...");
            try {
                Thread.sleep(1000000L);
            } catch (InterruptedException e) {
                e.printStackTrace();
            }
        }, "thread2").start();

        new Thread(null, () -> {
            System.out.println("3...");
            try {
                Thread.sleep(1000000L);
            } catch (InterruptedException e) {
                e.printStackTrace();
            }
        }, "thread3").start();
    }
}
然后在 linux 环境下启动这段代码,用后台的方式运行,命令如下,此时我们就模拟了生产环境 cpu 占用过高的场景。
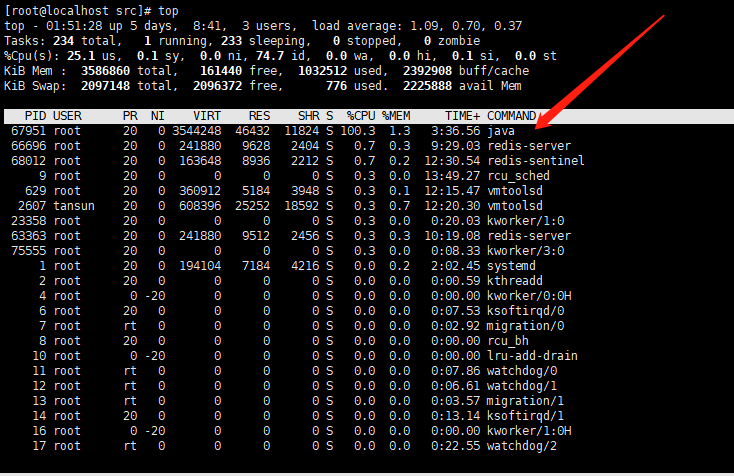
nohup java cn.itcast.jvm.t1.stack.Demo1_16 & 第一步:输入 top 命令查看当前 linux 进程的 cpu 占用情况,如下所示,我们发现我们的java进程的 cpu 几乎快要满了
第二步:使用 ps 命令来查看进程里面到底是哪个线程引起的 cpu 占用过高,命令如下:
# H 参数表示输出进程树
# -eo 参数表示后面需要输出的东西,比如 pid,tid,%cpu 表示对 cpu 的占用情况
# grep 表示筛选指定的进程 id
ps H -eo pid,tid,%cpu | grep 进程id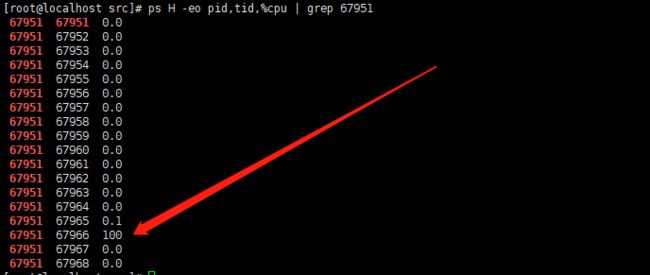
第三步:使用 jstack工具,他会把我们这个进程中的所有线程 id 给我们列出来
jstack 进程 id[root@localhost src]# jstack 67951
2023-09-06 01:58:54
Full thread dump OpenJDK 64-Bit Server VM (25.262-b10 mixed mode):
"Attach Listener" #13 daemon prio=9 os_prio=0 tid=0x00007f3424001000 nid=0x10c2f waiting on condition [0x0000000000000000]
java.lang.Thread.State: RUNNABLE
"DestroyJavaVM" #12 prio=5 os_prio=0 tid=0x00007f346804b800 nid=0x10970 waiting on condition [0x0000000000000000]
java.lang.Thread.State: RUNNABLE
"thread3" #11 prio=5 os_prio=0 tid=0x00007f34681ee800 nid=0x10980 waiting on condition [0x00007f344fad1000]
java.lang.Thread.State: TIMED_WAITING (sleeping)
at java.lang.Thread.sleep(Native Method)
at cn.itcast.jvm.t1.stack.Demo1_16.lambda$main$2(Demo1_16.java:29)
at cn.itcast.jvm.t1.stack.Demo1_16$$Lambda$3/135721597.run(Unknown Source)
at java.lang.Thread.run(Thread.java:748)
"thread2" #10 prio=5 os_prio=0 tid=0x00007f34681ec800 nid=0x1097f waiting on condition [0x00007f344fbd2000]
java.lang.Thread.State: TIMED_WAITING (sleeping)
at java.lang.Thread.sleep(Native Method)
at cn.itcast.jvm.t1.stack.Demo1_16.lambda$main$1(Demo1_16.java:20)
at cn.itcast.jvm.t1.stack.Demo1_16$$Lambda$2/303563356.run(Unknown Source)
at java.lang.Thread.run(Thread.java:748)
"thread1" #9 prio=5 os_prio=0 tid=0x00007f34681ea800 nid=0x1097e runnable [0x00007f34541ab000]
java.lang.Thread.State: RUNNABLE
at cn.itcast.jvm.t1.stack.Demo1_16.lambda$main$0(Demo1_16.java:11)
at cn.itcast.jvm.t1.stack.Demo1_16$$Lambda$1/471910020.run(Unknown Source)
at java.lang.Thread.run(Thread.java:748)
"Service Thread" #8 daemon prio=9 os_prio=0 tid=0x00007f3468136800 nid=0x1097c runnable [0x0000000000000000]
java.lang.Thread.State: RUNNABLE
"C1 CompilerThread2" #7 daemon prio=9 os_prio=0 tid=0x00007f3468123800 nid=0x1097b waiting on condition [0x0000000000000000]
java.lang.Thread.State: RUNNABLE
"C2 CompilerThread1" #6 daemon prio=9 os_prio=0 tid=0x00007f3468121800 nid=0x1097a waiting on condition [0x0000000000000000]
java.lang.Thread.State: RUNNABLE
"C2 CompilerThread0" #5 daemon prio=9 os_prio=0 tid=0x00007f3468114000 nid=0x10979 waiting on condition [0x0000000000000000]
java.lang.Thread.State: RUNNABLE
"Signal Dispatcher" #4 daemon prio=9 os_prio=0 tid=0x00007f3468112000 nid=0x10978 runnable [0x0000000000000000]
java.lang.Thread.State: RUNNABLE
"Finalizer" #3 daemon prio=8 os_prio=0 tid=0x00007f34680e4000 nid=0x10977 in Object.wait() [0x00007f34548e3000]
java.lang.Thread.State: WAITING (on object monitor)
at java.lang.Object.wait(Native Method)
- waiting on <0x00000000edc08ee0> (a java.lang.ref.ReferenceQueue$Lock)
at java.lang.ref.ReferenceQueue.remove(ReferenceQueue.java:144)
- locked <0x00000000edc08ee0> (a java.lang.ref.ReferenceQueue$Lock)
at java.lang.ref.ReferenceQueue.remove(ReferenceQueue.java:165)
at java.lang.ref.Finalizer$FinalizerThread.run(Finalizer.java:216)
"Reference Handler" #2 daemon prio=10 os_prio=0 tid=0x00007f34680df800 nid=0x10976 in Object.wait() [0x00007f34549e4000]
java.lang.Thread.State: WAITING (on object monitor)
at java.lang.Object.wait(Native Method)
- waiting on <0x00000000edc06c00> (a java.lang.ref.Reference$Lock)
at java.lang.Object.wait(Object.java:502)
at java.lang.ref.Reference.tryHandlePending(Reference.java:191)
- locked <0x00000000edc06c00> (a java.lang.ref.Reference$Lock)
at java.lang.ref.Reference$ReferenceHandler.run(Reference.java:153)
"VM Thread" os_prio=0 tid=0x00007f34680d5800 nid=0x10975 runnable
"GC task thread#0 (ParallelGC)" os_prio=0 tid=0x00007f346805e000 nid=0x10971 runnable
"GC task thread#1 (ParallelGC)" os_prio=0 tid=0x00007f3468060000 nid=0x10972 runnable
"GC task thread#2 (ParallelGC)" os_prio=0 tid=0x00007f3468062000 nid=0x10973 runnable
"GC task thread#3 (ParallelGC)" os_prio=0 tid=0x00007f3468063800 nid=0x10974 runnable
"VM Periodic Task Thread" os_prio=0 tid=0x00007f346814b800 nid=0x1097d waiting on condition
JNI global references: 311
[root@localhost src]#
第四步:根据我们在第二步找到的线程 id 为 67966,这个是十进制的,而我们第三步输出的线程 id 为十六进制的,需要将 67966 转换为十六进制的形式为:1097e;然后查看查看第三步的线程 id 为 1097e 的线程,如下所示:
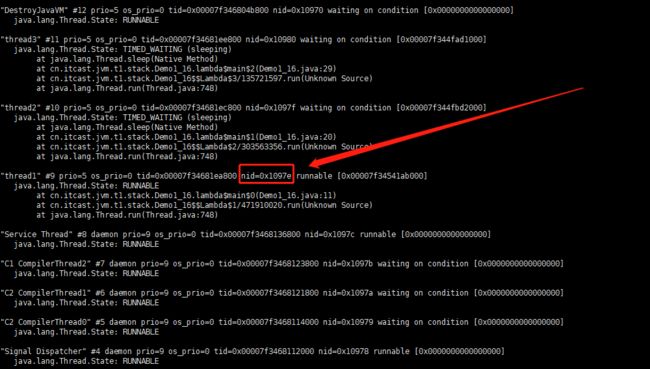
此时我们就定位到了问题出现了 Thread-1 的这个线程这里,他的线程状态是 Runnable ,处于一直运行的状态,就是他导致的 cpu 占用过高的问题,从它的下面就可以看出来是第 11 行的代码出现了问题,接下来就可以解决了。
2.5.2 程序运行长时间没有结果
想象一个场景,比如点击新增按钮长时间没有返回,或者其他的那种长时间服务器没有反应的情况,该怎么办呢?我们用代码来模拟下这种场景,代码如下所示:
package cn.itcast.jvm.t1.stack;

/**
 * 演示线程死锁
 */
class A{};
class B{};
public class Demo1_3 {
    static A a = new A();
    static B b = new B();


    public static void main(String[] args) throws InterruptedException {
        new Thread(()->{
            synchronized (a) {
                try {
                    Thread.sleep(2000);
                } catch (InterruptedException e) {
                    e.printStackTrace();
                }
                synchronized (b) {
                    System.out.println("我获得了 a 和 b");
                }
            }
        }).start();
        Thread.sleep(1000);
        new Thread(()->{
            synchronized (b) {
                synchronized (a) {
                    System.out.println("我获得了 a 和 b");
                }
            }
        }).start();
    }

}
然后在 linux 环境下启动这段代码,用后台的方式运行,命令如下
[root@localhost src]# nohup java cn.itcast.jvm.t1.stack.Demo1_3 &
[1] 69772
第一步:使用 jstack 命令查看当前进程里面的线程情况,我们可以观察下最后的几行代码
[root@localhost src]# jstack 69772
2023-09-06 02:15:27
Full thread dump OpenJDK 64-Bit Server VM (25.262-b10 mixed mode):
"Attach Listener" #12 daemon prio=9 os_prio=0 tid=0x00007f513c001000 nid=0x110b8 waiting on condition [0x0000000000000000]
java.lang.Thread.State: RUNNABLE
"DestroyJavaVM" #11 prio=5 os_prio=0 tid=0x00007f517c04b800 nid=0x1108d waiting on condition [0x0000000000000000]
java.lang.Thread.State: RUNNABLE
"Thread-1" #10 prio=5 os_prio=0 tid=0x00007f517c20c800 nid=0x1109d waiting for monitor entry [0x00007f5166fc6000]
java.lang.Thread.State: BLOCKED (on object monitor)
at cn.itcast.jvm.t1.stack.Demo1_3.lambda$main$1(Demo1_3.java:30)
- waiting to lock <0x00000000edc64ab8> (a cn.itcast.jvm.t1.stack.A)
- locked <0x00000000edc65dc0> (a cn.itcast.jvm.t1.stack.B)
at cn.itcast.jvm.t1.stack.Demo1_3$$Lambda$2/303563356.run(Unknown Source)
at java.lang.Thread.run(Thread.java:748)
"Thread-0" #9 prio=5 os_prio=0 tid=0x00007f517c20a800 nid=0x1109c waiting for monitor entry [0x00007f51670c7000]
java.lang.Thread.State: BLOCKED (on object monitor)
at cn.itcast.jvm.t1.stack.Demo1_3.lambda$main$0(Demo1_3.java:22)
- waiting to lock <0x00000000edc65dc0> (a cn.itcast.jvm.t1.stack.B)
- locked <0x00000000edc64ab8> (a cn.itcast.jvm.t1.stack.A)
at cn.itcast.jvm.t1.stack.Demo1_3$$Lambda$1/471910020.run(Unknown Source)
at java.lang.Thread.run(Thread.java:748)
"Service Thread" #8 daemon prio=9 os_prio=0 tid=0x00007f517c136800 nid=0x1109a runnable [0x0000000000000000]
java.lang.Thread.State: RUNNABLE
"C1 CompilerThread2" #7 daemon prio=9 os_prio=0 tid=0x00007f517c123800 nid=0x11099 waiting on condition [0x0000000000000000]
java.lang.Thread.State: RUNNABLE
"C2 CompilerThread1" #6 daemon prio=9 os_prio=0 tid=0x00007f517c121800 nid=0x11098 waiting on condition [0x0000000000000000]
java.lang.Thread.State: RUNNABLE
"C2 CompilerThread0" #5 daemon prio=9 os_prio=0 tid=0x00007f517c114000 nid=0x11097 waiting on condition [0x0000000000000000]
java.lang.Thread.State: RUNNABLE
"Signal Dispatcher" #4 daemon prio=9 os_prio=0 tid=0x00007f517c112000 nid=0x11096 runnable [0x0000000000000000]
java.lang.Thread.State: RUNNABLE
"Finalizer" #3 daemon prio=8 os_prio=0 tid=0x00007f517c0e4000 nid=0x11095 in Object.wait() [0x00007f5167bfa000]
java.lang.Thread.State: WAITING (on object monitor)
at java.lang.Object.wait(Native Method)
- waiting on <0x00000000edc08ee0> (a java.lang.ref.ReferenceQueue$Lock)
at java.lang.ref.ReferenceQueue.remove(ReferenceQueue.java:144)
- locked <0x00000000edc08ee0> (a java.lang.ref.ReferenceQueue$Lock)
at java.lang.ref.ReferenceQueue.remove(ReferenceQueue.java:165)
at java.lang.ref.Finalizer$FinalizerThread.run(Finalizer.java:216)
"Reference Handler" #2 daemon prio=10 os_prio=0 tid=0x00007f517c0df800 nid=0x11094 in Object.wait() [0x00007f5167cfb000]
java.lang.Thread.State: WAITING (on object monitor)
at java.lang.Object.wait(Native Method)
- waiting on <0x00000000edc06c00> (a java.lang.ref.Reference$Lock)
at java.lang.Object.wait(Object.java:502)
at java.lang.ref.Reference.tryHandlePending(Reference.java:191)
- locked <0x00000000edc06c00> (a java.lang.ref.Reference$Lock)
at java.lang.ref.Reference$ReferenceHandler.run(Reference.java:153)
"VM Thread" os_prio=0 tid=0x00007f517c0d5800 nid=0x11093 runnable
"GC task thread#0 (ParallelGC)" os_prio=0 tid=0x00007f517c05e000 nid=0x1108f runnable
"GC task thread#1 (ParallelGC)" os_prio=0 tid=0x00007f517c060000 nid=0x11090 runnable
"GC task thread#2 (ParallelGC)" os_prio=0 tid=0x00007f517c062000 nid=0x11091 runnable
"GC task thread#3 (ParallelGC)" os_prio=0 tid=0x00007f517c063800 nid=0x11092 runnable
"VM Periodic Task Thread" os_prio=0 tid=0x00007f517c13b800 nid=0x1109b waiting on condition
JNI global references: 310
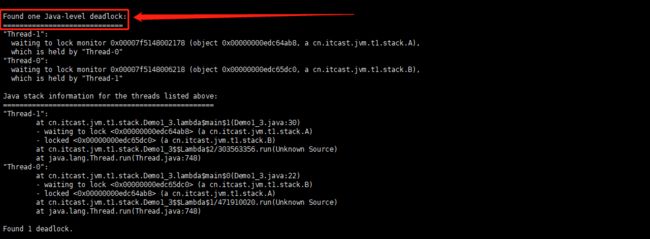
Found one Java-level deadlock:
=============================
"Thread-1":
waiting to lock monitor 0x00007f5148002178 (object 0x00000000edc64ab8, a cn.itcast.jvm.t1.stack.A),
which is held by "Thread-0"
"Thread-0":
waiting to lock monitor 0x00007f5148006218 (object 0x00000000edc65dc0, a cn.itcast.jvm.t1.stack.B),
which is held by "Thread-1"
Java stack information for the threads listed above:
===================================================
"Thread-1":
at cn.itcast.jvm.t1.stack.Demo1_3.lambda$main$1(Demo1_3.java:30)
- waiting to lock <0x00000000edc64ab8> (a cn.itcast.jvm.t1.stack.A)
- locked <0x00000000edc65dc0> (a cn.itcast.jvm.t1.stack.B)
at cn.itcast.jvm.t1.stack.Demo1_3$$Lambda$2/303563356.run(Unknown Source)
at java.lang.Thread.run(Thread.java:748)
"Thread-0":
at cn.itcast.jvm.t1.stack.Demo1_3.lambda$main$0(Demo1_3.java:22)
- waiting to lock <0x00000000edc65dc0> (a cn.itcast.jvm.t1.stack.B)
- locked <0x00000000edc64ab8> (a cn.itcast.jvm.t1.stack.A)
at cn.itcast.jvm.t1.stack.Demo1_3$$Lambda$1/471910020.run(Unknown Source)
at java.lang.Thread.run(Thread.java:748)
Found 1 deadlock.
第二步:从下面看就可以发现了死锁的说明,下面就是具体哪两个线程发生了死锁,然后解决就可以了。