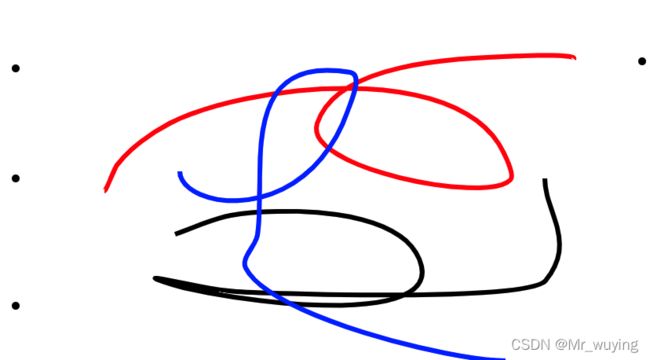
svg 根据鼠标滑动画曲线
npm install --save fit-curve
npm i raphael
<div id="container">
        <svg height="400" version="1.1" width="800" xmlns="http://www.w3.org/2000/svg" xmlns:xlink="http://www.w3.org/1999/xlink" style="overflow: hidden; position: relative;border:1px solid gray;stroke-width: 2px;"><desc style="-webkit-tap-highlight-color: rgba(0, 0, 0, 0);">Created with Raphaël 2.1.2</desc><defs style="-webkit-tap-highlight-color: rgba(0, 0, 0, 0);"></defs></svg>
      </div>
      <button class="btn" id="clear-button">清除</button><br>
      <button class="btn" id="retreat-button">撤退一条线</button><br>
import fitCurve from 'fit-curve'
import Raphael from 'raphael'
 data() {
    return {
      paper:'',
      zoonArr:0,
      selectArr:0,
      rawLines : [],
      rawLinesData: [],
      fittedCurves :[],
      fittedCurvesData: [],
      error: 50,
      showBezierDots: false,
      showBezierControlPoints : false,
      bezierDots :  [],
      bezierControlPoints :  [],
      bezierControlPointLines :  [],
      colorArr:['red','black','blue','yellow','green','purple']
    };
  },
  methods:{
  createSpineDemo() {
     this.paper = Raphael('container', 1150, 520);
    var container = document.getElementsByTagName('svg').item(0);
    var container1 = document.getElementsByTagName('svg').item(1);
    container.style.strokeWidth='6px'
    // container.style.transform= `scale(${$getCanvasScale()})`;
    container.style.transformOrigin='left top'
    // container.style.background='#fff'
    container.style.border='1px solid #ccc'
    container1.style.display='none'
    var clearButton = document.getElementById('clear-button');
    var retreatButton = document.getElementById('retreat-button');


    var isMouseDown = false;
    let that = this
    container.addEventListener('mousedown', function () {
        that.rawLinesData.push([]);
        isMouseDown = true;
    });
    container.addEventListener('mouseup', function () {
        isMouseDown = false;
    });
    container.addEventListener('mousemove', function (event) {
        if (isMouseDown) {
            var containerArea = container.getBoundingClientRect(),
                x = event.clientX - containerArea.left,
                y = event.clientY - containerArea.top;
            that.rawLinesData[that.rawLinesData.length - 1].push([x, y]);
            that.updateLines();

        }
    });


    clearButton.addEventListener('click', function () {
        that.rawLinesData = [];
        that.rawLines.concat(that.fittedCurves).forEach(function (rawLine) {
            rawLine.remove();
        });
        that.rawLines = [];
        that.fittedCurvesData = [];
        that.fittedCurves = [];

        that.cleanBezierHelpGraphics();
    });
    retreatButton.addEventListener('click',function(){
      that.rawLinesData.splice(that.rawLinesData.length-1,1)
       that.rawLines[that.rawLines.length-1].remove()
      that.fittedCurvesData[that.fittedCurvesData.length-1].remove()
      that.fittedCurves[that.fittedCurves.length-1].remove()
      that.rawLines.splice(that.rawLines.length-1,1)
      that.fittedCurvesData.splice(that.fittedCurvesData.length-1,1)
      that.fittedCurves.splice(that.fittedCurves.length-1,1)

      that.updateLines()
    })


      //

    },
  lineDataToPathString(lineData) {
        var str = "";
        lineData.map(function (xy, i) {
            if (i == 0) {
                str += "M ";
            } else {
                str += "L ";
            }
            str += xy[0] + " " + xy[1] + " ";
        });
        return str;
    },
    fittedCurveDataToPathString(fittedLineData) {
        var str = "";
        fittedLineData.map(function (bezier, i) {
            if (i == 0) {
                str += "M " + bezier[0][0] + " " + bezier[0][1];
            }
            str += "C " + bezier[1][0] + " " + bezier[1][1] + ", " +
                bezier[2][0] + " " + bezier[2][1] + ", " +
                bezier[3][0] + " " + bezier[3][1] + " ";
        });

        return str;
    },
    cleanBezierHelpGraphics(){
        this.bezierDots
            .concat(this.bezierControlPoints)
            .concat(this.bezierControlPointLines)
            .forEach(function(el){
                el.remove();
            });
        this.bezierDots = [];
        this.bezierControlPoints = [];
        this.bezierControlPointLines = [];
    },
    updateLines(updateAllCurves) {
      // localStorage.setItem('data',JSON.stringify(rawLinesData))
      // console.log(this.rawLinesData)
      let that=this
        this.rawLinesData.forEach(function (lineData, i) {
          // console.log(lineData,'lineData')
            if (that.rawLines.length <= i) {
                var path = that.paper.path('');
                path.attr({
                    stroke: ''
                });
                that.rawLines.push(path);
                console.log(lineData,'lineData')
            }
            that.rawLines[i].attr("path", that.lineDataToPathString(lineData));
            // var isLastItem = i === that.rawLinesData.length - 1;
            // if (updateAllCurves ) {
              // console.log(that.fittedCurves.length <= i)
                if (that.fittedCurves.length <= i) {
                    path = that.paper.path('');
                      path.attr({
                          stroke: that.colorArr[i]
                      });
                    that.fittedCurves.push(path);

                }

                if (lineData.length > 1) {

                    that.fittedCurvesData[i] = fitCurve(lineData, that.error);
                    // console.log(that.fittedCurves,'fittedCurves')
                    // console.log(i)
                    //console.log(lineData.length, lineData.map(function(arr){return "["+arr.join(",")+"]";}).join(","));

                      that.fittedCurves[i].attr("path", that.fittedCurveDataToPathString(that.fittedCurvesData[i]));

                }
            // }
        });

        that.cleanBezierHelpGraphics();

        that.fittedCurvesData.forEach(function (beziers) {
            beziers.forEach(function (bezier, i) {
                var p1 = bezier[0];
                var cp1 = bezier[1];
                var cp2 = bezier[2];
                var p2 = bezier[3];
                var getDotCircle = function (p) {
                    var circle = that.paper.circle(p[0], p[1], 5);
                    circle.attr({
                        fill: 'rgb(200, 50, 0)',
                        'fill-opacity': 0.5,
                        stroke: null
                    });
                    return circle;
                };

                var getControlPoint = function (p) {
                    var circle = that.paper.circle(p[0], p[1], 2);
                    circle.attr({
                        fill: 'rgb(100, 200, 0)',
                        'fill-opacity': 0.5,
                        stroke: null
                    });
                    return circle;
                };

                var getControlLine = function (p1, p2) {
                    var pathString = "M " + p1[0] + " " + p1[1] + " ";
                    pathString += "L " + p2[0] + " " + p2[1];
                    var line = that.paper.path(pathString);
                    line.attr({
                        stroke: 'rgb(100, 200, 0)',
                        'stroke-opacity': 0.5
                    });
                    return line;
                };

                if (that.showBezierDots) {
                    if (i == 0) {
                        that.bezierDots.push(getDotCircle(p1));
                    }
                    that.bezierDots.push(getDotCircle(p2));
                }
                // console.log(bezierDots)
                if (that.showBezierControlPoints) {
                    that.bezierControlPointLines.push(getControlLine(p1, cp1));
                    that.bezierControlPointLines.push(getControlLine(cp2, p2));
                    that.bezierControlPoints.push(getControlPoint(cp1));
                    that.bezierControlPoints.push(getControlPoint(cp2));
                }
            });
        });
    },
   }

