echarts-图表(非常规图开发记录)
echarts-图表(非常规图开发记录)
- 环形刻度图
- 横向左右柱形图
- 3D饼图
- 渐变柱子-柱状图
- 3D柱状图
- 雷达图
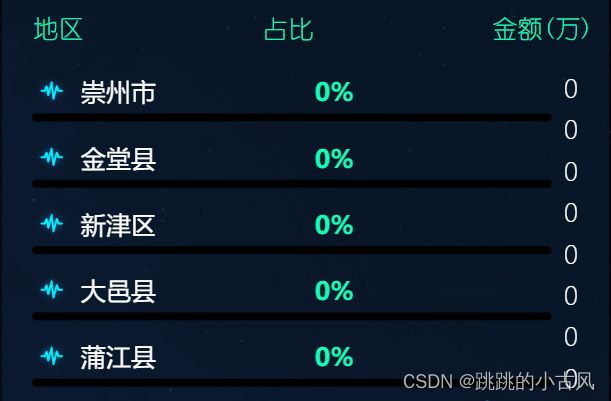
- 动态滚动图-并加图片
以下图表数据源,allData.value 均为如下格式
 [{
    "id": "1",
    "name": "在职在岗",
    "value": 3
  },
  {
    "id": "7",
    "name": "其他",
    "value": 0
  },
]
环形刻度图

 let colorList = ['#EA7267', '#F0D84B', '#7AE72F']
  let total = allData.value.reduce((sum, obj) => sum + obj.value, 0) //计算总和
  const initOption = {
    grid: {
      left: 0,
    },
    legend: {
      right: 40,
      top: 'center',
      itemGap: 20,
      itemWidth: 14,
      orient: 'vertical',
      textStyle: 12,
    },
    tooltip: {
      confine: true,
      trigger: 'item',
      formatter: '{b} : {c}',
    },
    title: {
      text: total,
      textAlign: 'center',
      x: '38%',
      y: '38%',
      textStyle: {
        color: '#FFA951',
        fontSize: 12,
      },
      subtext: '总数',
      subtextStyle: {
        color: '#fff',
        fontSize:10,
      },
    },
    series: [
      {
        name: '',
        type: 'pie',
        radius: ['35%', '50%'],
        center: ['40%', '50%'],
        clockwise: false,
        avoidLabelOverlap: false,
        legendHoverLink: true,
        label: {
          show: true,
          formatter: function (params) {
            return `${params.value.toLocaleString()}\n{a|${params.name}}`
          },
          color: '#8799BF',
          fontSize: 18,
          lineHeight: 21,
          rich: {
            a: { //单独给某个属性设置样式
              color: '#C0D0E7',
              fontWeight: 'bold',
              fontSize: 18,
            },
          },
        },
        labelLine: {
          normal: {
            length: 10,
            length2: 30,
          },
        },
        data: allData.value.map((item, index) => {
          item.label = {
            color: colorList[index],
          }
          return item
        }),
        itemStyle: {
          borderWidth: 5, //设置border的宽度有多大
          borderColor: 'rgb(7,10,23',
          color: (params) => {
            var index = params.dataIndex
            return colorList[index]
          },
        },
      },
      {
        type: 'gauge',
        splitNumber: 15,
        radius: '75%',
        center: ['40%', '50%'],
        startAngle: 0,
        endAngle: -269.9999,
        axisLine: {
          show: false,
          lineStyle: {
            color: [[1, '#4E78F1']],
          },
        },
        axisTick: {
          show: false,
        },
        splitLine: {
          show: true,
          length: 8,
          lineStyle: {
            color: 'auto',
            width: 2,
          },
        },
        axisLabel: {
          show: false,
        },
        detail: {
          show: false,
        },
      },
      {
        type: 'gauge',
        splitNumber: 15,
        radius: '75%',
        center: ['40%', '50%'],
        startAngle: 90,
        endAngle: -269.9999,
        axisLine: {
          show: false,
        },
        axisTick: {
          show: true,
          lineStyle: {
            color: '#06AEFC',
            width: 1,
          },
          length: 8,
          splitNumber: 5,
        },
        splitLine: {
          show: false,
        },
        axisLabel: {
          show: false,
        },
        detail: {
          show: false,
        },
      },
    ],
  }
横向左右柱形图

  let xData = [
    '18-25',
    '26-30',
    '31-35',
    '36-40',
    '41-45',
    '46-50',
    '51-55',
    '56以上',
    '未知',
  ]
  let dataman = allData.value.map((o) => o.value)
  let datawoman = allDataTwo.value.map((o) => o.value)
  const initOption = {
    title: [
      {
        x: '44%',
        y: '3%',
        textAlign: 'right',
        text: '男',
        textStyle: {
          color: 'white',
          fontSize: Math.round(titleFontSize * 2.1),
          fontWeight: 100,
        },
      },
      {
        x: '52%',
        y: '3%',
        textAlign: 'center',
        text: '年龄',
        textStyle: {
          color: 'white',
          fontSize: Math.round(titleFontSize * 2.1),
          fontWeight: 100,
        },
      },
      {
        x: '60%',
        y: '3%',
        textAlign: 'left',
        text: '女',
        textStyle: {
          color: 'white',
          fontSize: Math.round(titleFontSize * 2.1),
          fontWeight: 100,
        },
      },
    ],
    color: ['#333FFF', '#23B899'],
    timeline: {
      show: false,
    },
    tooltip: {
      trigger: 'axis',
      formatter: '{b} :\n\n{c} 人',
    },
    grid: [
      {
        show: false,
        left: '8%',
        top: '16%',
        bottom: '15%',
        width: '37%',
        containLabel: true,
      },
      {
        show: false,
        left: '55%',
        top: '16%',
        bottom: '15%',
        width: '0%',
      },
      {
        show: false,
        right: '8%',
        top: '16%',
        bottom: '15%',
        containLabel: true,
        width: '31%',
      },
    ],
    xAxis: [
      {
        type: 'value',
        inverse: true,
        axisLine: {
          show: false,
        },
        axisTick: {
          show: false,
        },
        position: 'top',
        axisLabel: {
          show: false,
        },
        splitLine: {
          show: false,
        },
      },
      {
        gridIndex: 1,
        show: false,
      },
      {
        gridIndex: 2,
        axisLine: {
          show: false,
        },
        axisTick: {
          show: false,
        },
        position: 'top',
        axisLabel: {
          show: false,
        },
        splitLine: {
          show: false,
        },
      },
    ],
    yAxis: [
      {
        type: 'category',
        inverse: true,
        position: 'center',
        axisLine: {
          show: false,
        },
        axisTick: {
          show: false,
        },
        axisLabel: {
          show: false,
        },
        data: xData,
      },
      {
        gridIndex: 1,
        type: 'category',
        inverse: true,
        position: 'left',
        axisLine: {
          show: false,
        },
        axisTick: {
          show: false,
        },
        axisLabel: {
          show: true,
          color: '#ffffff',
          fontSize: Math.round(titleFontSize * 1.8),
          align: 'center',
          interval: 0,
        },
        data: xData.map(function (value) {
          return {
            value: value,
            textStyle: {
              align: 'center',
            },
          }
        }),
      },
      {
        gridIndex: 2,
        type: 'category',
        inverse: true,
        position: 'left',
        axisLine: {
          show: false,
        },
        axisTick: {
          show: false,
        },
        axisLabel: {
          show: false,
        },
        data: xData,
      },
    ],
    series: [
      {
        type: 'bar',
        barWidth: 10,
        stack: '1',
        itemStyle: {
          color: new echarts.graphic.LinearGradient(0, 0, 1, 0, [
            {
              offset: 0,
              color: 'rgba(69, 239, 253, 1)',
            },
            {
              offset: 1,
              color: 'rgba(69, 239, 253, 0)',
            },
          ]),
          borderWidth: 2,
          borderColor: '#1FF2C0',
        },
        label: {
          show: true,
          position: 'left',
          color: '#45EFFD',
        },
        data: dataman,
        animationEasing: 'elasticOut',
      },
      {
        type: 'bar',
        stack: '2',
        barWidth: 10,
        xAxisIndex: 2,
        yAxisIndex: 2,
        itemStyle: {
          color: new echarts.graphic.LinearGradient(0, 0, 1, 0, [
            {
              offset: 0,
              color: 'rgba(255, 191, 10, 0)',
            },
            {
              offset: 1,
              color: '#F7546B',
            },
          ]),
          borderWidth: 2,
          borderColor: '#F7546B',
        },
        label: {
          show: true,
          position: 'right',
          color: '#FFBF0A',
        },
        data: datawoman,
        animationEasing: 'elasticOut',
      },
    ],
  }
3D饼图

import { getPie3D } from './pie3D.js' //引入

 let colorList = ['#EA7267', '#F0D84B', '#7AE72F']
  const series = getPie3D(allData.value, 0.5)
  series.push({
    name: 'pie2d',
    type: 'pie',
    label: {
      opacity: 1,
      fontSize: 16,
      lineHeight: 20,
    },
    labelLine: {
      length: 50,
      length2: 50,
    },
    startAngle: -50, //起始角度,支持范围[0, 360]。
    clockwise: false, //饼图的扇区是否是顺时针排布。上述这两项配置主要是为了对齐3d的样式
    radius: ['20%', '10%'],
    center: ['50%', '50%'],
    data: allData.value.map((item, index) => {
      item.label = {
        color: colorList[index],
      }
      return item
    }),
    itemStyle: {
      opacity: 0,
    },
  })
  const initOption = {
    legend: {
      show: false,
    },
    color: colorList,
    tooltip: {
      trigger: 'item',
      triggerOn: 'mousemove',
      show: true,
      axisPointer: {
        type: 'line',
      },
      // formatter: "{a}:{c}",
      formatter: function (params) {
        return (
          '' +
          params.data.name[0] +
          params.data.name[1] +
          ':' +
          params.data.value +
          ''
        )
      },
    },
    title: {
      show: false,
    },
    label: {
      show: true,
      formatter: function (params) {
        return `${params.value.toLocaleString()}\n{a|${params.name}}`
      },
      color: '#8799BF',
      fontSize: 16,
      lineHeight: 21,
      rich: {
        a: {
          color: '#C0D0E7',
          fontWeight: 'bold',
          fontSize: 16,
        },
      },
    },
    labelLine: {
      normal: {
        length: 10,
        length2: 30,
      },
    },
    xAxis3D: {
      min: -1,
      max: 1,
    },
    yAxis3D: {
      min: -1,
      max: 1,
    },
    zAxis3D: {
      min: -1,
      max: 1,
    },
    grid3D: {
      show: false,
      boxHeight: 25, // 三维笛卡尔坐标系在三维场景中的高度
      viewControl: {
        alpha: 45,
        // beta: 1000,
        distance: 300, //调整视角到主体的距离,类似调整zoom
        // rotateSensitivity: 0, // 设置为0无法旋转
        zoomSensitivity: 0, // 设置为0无法缩放
        panSensitivity: 0, // 设置为0无法平移
        autoRotate: false, // 自动旋转
      },
    },
    series: series,
  }
- pie3D.js
/**
 * 绘制3d图
 * @param pieData 总数据
 * @param internalDiameterRatio:透明的空心占比
 * @param distance 视角到主体的距离
 * @param alpha 旋转角度
 * @param pieHeight 立体的高度
 * @param opacity 饼或者环的透明度
 */
const getPie3D = (pieData, internalDiameterRatio, distance, alpha, pieHeight, opacity = 1) => {
  const series = [];
  let sumValue = 0;
  let startValue = 0;
  let endValue = 0;
  const legendData = [];
  const k =
      typeof internalDiameterRatio !== 'undefined'
          ? (1 - internalDiameterRatio) / (1 + internalDiameterRatio)
          : 1 / 3;
  // 为每一个饼图数据,生成一个 series-surface 配置
  for (let i = 0; i < pieData.length; i += 1) {
      sumValue += pieData[i].value;
      const seriesItem = {
          name: typeof pieData[i].name === 'undefined' ? `series${i}` : pieData[i].name,
          type: 'surface',
          parametric: true,
          wireframe: {
              show: false,
          },
          pieData: pieData[i],
          pieStatus: {
              selected: false,
              hovered: false,
              k: k,
          },
          itemStyle:{}
      };
      if (typeof pieData[i].itemStyle !== 'undefined') {
          const itemStyle= {};
          if (typeof pieData[i].itemStyle.color !== 'undefined') {
              itemStyle.color = pieData[i].itemStyle.color;
          }
          if (typeof pieData[i].itemStyle.opacity !== 'undefined') {
              itemStyle.opacity = pieData[i].itemStyle.opacity;
          }
          seriesItem.itemStyle = itemStyle;
      }
      series.push(seriesItem);
  }
  // 使用上一次遍历时,计算出的数据和 sumValue,调用 getParametricEquation 函数,
  // 向每个 series-surface 传入不同的参数方程 series-surface.parametricEquation,也就是实现每一个扇形。
  for (let i = 0; i < series.length; i += 1) {
      endValue = startValue + series[i].pieData.value;
      series[i].pieData.startRatio = startValue / sumValue;
      series[i].pieData.endRatio = endValue / sumValue;
      console.log(series[i].pieData.startRatio,
          series[i].pieData.endRatio,
          false,
          false,
          k,
          series[i].pieData.value)
          series[i].parametricEquation = getParametricEquation(
          series[i].pieData.startRatio,
          series[i].pieData.endRatio,
          false,
          false,
          k,
          25//高度
      );
      startValue = endValue;
      legendData.push(series[i].name);
  }
  return series
}

/**
 * 生成扇形的曲面参数方程,用于 series-surface.parametricEquation
 */
const getParametricEquation = (startRatio, endRatio, isSelected, isHovered, k, h) => {
  // 计算

  const midRatio = (startRatio + endRatio) / 2;

  const startRadian = startRatio * Math.PI * 2;

  const endRadian = endRatio * Math.PI * 2;

  const midRadian = midRatio * Math.PI * 2;

  // 如果只有一个扇形,则不实现选中效果。

  if (startRatio === 0 && endRatio === 1) {

    isSelected = false;

  }

  // 通过扇形内径/外径的值,换算出辅助参数 k(默认值 1/3)

  k = 1;

  // 计算选中效果分别在 x 轴、y 轴方向上的位移(未选中,则位移均为 0)

  const offsetX = isSelected ? Math.cos(midRadian) * 0.1 : 0;

  const offsetY = isSelected ? Math.sin(midRadian) * 0.1 : 0;

  // 计算高亮效果的放大比例(未高亮,则比例为 1)

  const hoverRate = isHovered ? 1.05 : 1;

  // 返回曲面参数方程

  return {

    u: {

      min: -Math.PI,

      max: Math.PI * 3,

      step: Math.PI / 32,

    },

    v: {

      min: 0,

      max: Math.PI * 2,

      step: Math.PI / 20,

    },

    x: function (u, v) {

      if (u < startRadian) {

        return offsetX + Math.cos(startRadian) * (1 + Math.cos(v) * k) * hoverRate;

      }

      if (u > endRadian) {

        return offsetX + Math.cos(endRadian) * (1 + Math.cos(v) * k) * hoverRate;

      }

      return offsetX + Math.cos(u) * (1 + Math.cos(v) * k) * hoverRate;

    },

    y: function (u, v) {

      if (u < startRadian) {

        return offsetY + Math.sin(startRadian) * (1 + Math.cos(v) * k) * hoverRate;

      }

      if (u > endRadian) {

        return offsetY + Math.sin(endRadian) * (1 + Math.cos(v) * k) * hoverRate;

      }

      return offsetY + Math.sin(u) * (1 + Math.cos(v) * k) * hoverRate;

    },

    z: function (u, v) {

      if (u < -Math.PI * 0.5) {

        return Math.sin(u);

      }

      if (u > Math.PI * 2.5) {

        return Math.sin(u) * h * 0.1;

      }

      return Math.sin(v) > 0 ? 1 * h * 0.1 : -1;

    },

  };
}

export { getPie3D, getParametricEquation }
渐变柱子-柱状图

  const initOption = {
    // backgroundColor: '#081736',
    tooltip: {
      confine: true,
      trigger: 'axis',
      formatter: '{a} : {c}',
    },
    legend: {
      show: false,
    },
    grid: {
      top: '20%',
      right: '0%',
      left: '10%',
      bottom: '25%',
    },
    xAxis: [
      {
        type: 'category',
        axisLabel: {
          color: '#fff',
          interval: 0,
          fontSize: 16,
          rotate: 20,
        },
        axisLine: {
          show: true,
          lineStyle: {
            color: '#b9c8da33',
          },
        },
        axisTick: {
          show: false,
        },
        splitLine: {
          show: false,
          lineStyle: {
            color: '#195384',
            type: 'dotted',
          },
        },
        data: [
          '18-25',
          '26-30',
          '31-35',
          '36-40',
          '41-45',
          '46-50',
          '51-55',
          '56以上',
          '未知',
        ],
      },
    ],
    yAxis: [
      {
        type: 'value',
        name: '人',
        min: 0,
        position: 'left',
        nameTextStyle: {
          color: '#fff',
          fontSize: 16,
        },

        axisLine: {
          show: true,
          lineStyle: {
            color: '#b9c8da33',
          },
        },
        axisTick: {
          show: false,
        },
        splitLine: {
          show: false,
          lineStyle: {
            color: '#0a3e98',
            type: 'dotted',
          },
        },
        axisLabel: {
          formatter: '{value}',
          textStyle: {
            color: '#fff',
            fontSize: 16,
          },
        },
      },
    ],
    series: [
      {
        name: '人数',
        type: 'bar',
        barWidth: 15, //柱子宽度
        barGap: 0.3, //柱子之间间距
        itemStyle: {
          normal: { //渐变配置
            color: new echarts.graphic.LinearGradient(0, 0, 0, 0.7, [
              {
                offset: 0,
                color: '#00FFAE',
              },
              {
                offset: 1,
                color: '#425052',
              },
            ]),
          },
        },
        label: {
          normal: {
            show: false,
            position: 'top',
            formatter: '{c}',
            color: '#fff',
          },
        },
        data: allData.value.map((o) => o),
      },
    ],
  }
3D柱状图

const data = allData.value.map((o) => o.value)
  const barWidth = 30
  const initOption = {
    tooltip: {
      confine: true,
      trigger: 'axis',
      formatter: '{b} : {c}',
    },
    //图表大小位置限制
    grid: {
      x: '10%',
      x2: '5%',
      y: '15%',
      y2: '20%',
    },
    xAxis: {
      data: allData.value.map((o) => o.name),
      //坐标轴
      axisLine: {
        show: true,
        lineStyle: {
          color: '#b9c8da33',
        },
      },
      type: 'category',
      axisLabel: {
        color: '#fff',
        interval: 0,
        rotate: 20,
        textStyle: {
          fontWeight: 500,
          fontSize: '16',
        },
      },
      axisTick: {
        textStyle: {
          color: '#fff',
          fontSize: '16',
        },
        show: false,
      },
    },
    yAxis: {
      nameTextStyle: {
        color: '#DEDEDE',
        fontSize: 12,
        padding: 10,
      },
      // min: 0, //最小
      // max: 2, //最大
      // interval: 0.5, //相差
      type: 'value',
      splitLine: {
        show: false,
        lineStyle: {
          type: 'dashed', //线的类型 虚线0
          opacity: 0.2, //透明度
        },
      },
      axisTick: {
        show: false,
      },
      axisLine: {
        show: true,
        lineStyle: {
          color: '#b9c8da33',
        },
      },
      //坐标值标注
      axisLabel: {
        show: true,
        textStyle: {
          color: '#C5DFFB',
          fontSize: 16,
        },
      },
    },
    series: [
      //中
      {
        z: 1,
        type: 'bar',
        barWidth: barWidth,
        barGap: '0%',
        data: data,
        itemStyle: {
          normal: {
            color: {
              type: 'linear',
              x: 0,
              x2: 1,
              y: 0,
              y2: 0,
              colorStops: [
                { offset: 0, color: 'rgba(207, 228, 255, .85)' },
                { offset: 0.5, color: 'rgba(207, 228, 255, .85)' },
                { offset: 0.5, color: 'rgba(140, 184, 247, .9)' },
                { offset: 1, color: 'rgba(140, 184, 247, .9)' },
              ],
            },
            //柱形图上方标题
            label: {
              show: true,
              position: 'top',
              textStyle: {
                color: 'rgb(1, 255, 250)',
                fontSize: 16,
              },
            },
          },
        },
      },
      //下
      {
        z: 2,
        name: '',
        type: 'pictorialBar',
        data: data.map((item) => item + 90),
        symbol: 'diamond',
        symbolOffset: ['0%', '0%'],
        symbolSize: [barWidth, 10],
        itemStyle: {
          normal: {
            color: 'transparent',
          },
        },
        tooltip: {
          show: false,
        },
      },
      //上
      {
        z: 3,
        name: '绿色',
        type: 'pictorialBar',
        symbolPosition: 'end',
        data: data,
        symbol: 'diamond',
        symbolOffset: ['0%', '-58%'],
        symbolSize: [barWidth - 4, (10 * (barWidth - 4)) / barWidth],
        itemStyle: {
          normal: {
            borderWidth: 2,
            color: '#c3dafb',
          },
        },
        tooltip: {
          show: false,
        },
      },
    ],
  }
雷达图

var data = allData.value
  let valueObj = {};
  data.forEach((m) => {
    valueObj[m.name] = m.value;
  });

  let dataArr = [];
  data.forEach((item) => {
    dataArr.push(item.value);
  });

  const initOption = {
    backgroundColor: "#174e8038",
    gird: {
      top: 200,
    },
    radar: {
      radius: "50%", //大小
      nameGap: 10, // 图中工艺等字距离图的距离
      center: ["50%", "50%"], // 图的位置
      name: {
        formatter: function (name, indicator) {
          var value = valueObj[name];
          return '{name|' + name + '}\n' + '{value|' + value + '}';
        },
        rich: {
          name: {
            fontSize: 17,
            color: '#fff',
            align: 'center',
          },
          value: {
            fontSize: 17,
            padding: [5, 0, 0, 0],
            color: '#FF9600',
          },

        },
      },
      indicator: data,
      axisLine: {
        show: true,
        lineStyle: {
          width: 0.5,
          color: "#FF9600",
        },
      },
      splitArea: {
        show: false,
      },
      splitLine: {
        show: true,
        lineStyle: {
          width: 0.5,
          color: "#FF9600", // 设置网格的颜色
        },
      },
    },

    series: [
      {
        type: "radar",
        symbol: "angle",
        itemStyle: {
          normal: {
            areaStyle: { type: "default" },
          },
        },
        data: [
          {
            symbol: "circle",
            symbolSize: 0,
            value: [70, 42, 63, 84, 75, 34],
            areaStyle: {
              color: new echarts.graphic.LinearGradient(0, 0, 0, 0.7, [
                {
                  offset: 0,
                  color: "#FF621F",
                },
                {
                  offset: 1,
                  color: "#FFD942",
                },
              ]),
            },
            lineStyle: {
              color: "#FF9600",
              width: 1,
            },
          },
        ],
      },
    ],
  };
动态滚动图-并加图片

  var salvProName = allData.value.map((o) => o.name);
  var salvProValue = allData.value.map((o) => o.value);
  var salvProMax = []; //背景按最大值
  for (let i = 0; i < salvProValue.length; i++) {
    salvProMax.push(100);
  }

  const initOption = {
    grid: {
      left: "5%",
      right: "5%",
      bottom: "2%",
      top: "10%",
      containLabel: true,
    },
    legend: {
      show: false,
    },
    dataZoom: [
      //滑动条
      {
        yAxisIndex: 0, //这里是从X轴的0刻度开始
        show: false, //是否显示滑动条,不影响使用
        type: "inside", // 这个 dataZoom 组件是 slider 型 dataZoom 组件
        startValue: 0, // 从头开始。
        endValue: 4, // 一次性展示几个。
      },
    ],
    tooltip: {
      trigger: "axis",
      axisPointer: {
        type: "none",
      },
      formatter: function (params) {
        return params[0].name + " : " + params[0].value;
      },
    },
    xAxis: {
      show: false,
      type: "value",
    },
    yAxis: [
      {
        type: "category",
        inverse: true,
        axisLabel: {
          show: false,
        },
        splitLine: {
          show: false,
        },
        axisTick: {
          show: false,
        },
        axisLine: {
          show: false,
        },
        data: salvProName,
      },
      {
        type: "category",
        inverse: true,
        axisTick: "none",
        axisLine: "none",
        show: true,
        axisLabel: {
          textStyle: {
            color: "#fff",
            fontWeight: "100",
            fontSize:16
          },
        },
        data: salvProValue,
      },
    ],
    series: [
      {
        name: "值",
        type: "bar",
        zlevel: 1,
        itemStyle: {
          normal: {
            barBorderRadius: 5,
            color: new echarts.graphic.LinearGradient(0, 0, 1, 0, [
              {
                offset: 0,
                color: "rgb(10, 116, 255,.2)",
              },
              {
                offset: 1,
                color: "rgb(167,237,241,1)",
              },
            ]),
          },
        },
        z: 2,
        barWidth: 5,
        data: salvProValue,
        label: {
          normal: {
            color: "#555",
            show: true,
            position: [0, -26],
            textStyle: {
              fontSize: 16,
              color: "#fff",
            },
            rich: {
              icon: {
                fontSize: 20,
                padding: [4, 0, 0, 0],
                backgroundColor: { //添加图片代码
                  image: new URL(
                    "../../../assets/images/FundDistribution/short.png",
                    import.meta.url
                  ).href,
                },
              },
              name: {
                fontSize: 16,
                padding: [4, 0, 0, 5],
                color: "#fefefe",
              },
              value: {
                fontSize: 16,
                fontWeight: "bolder",
                padding: [4, 0, 0, Yhleft.value],
                color: "#0DFFB8",
                // color: '#333333'
              },
            },
            formatter: (params) => {
              return (
                "{icon| }{name|" +
                (params.name.split("").length == 3
                  ? params.name + "\t\t\t\t\t\t\t\t\t\t"
                  : params.name.split("").length == 4
                  ? params.name + "\t\t\t\t\t\t\t"
                  : params.name.split("").length == 5
                  ? params.name + "\t\t\t"
                  : params.name) +
                "}{value|" +
                params.value +
                "%}"
              );
            },
          },
        },
      },
      {
        name: "背景",
        type: "bar",
        barWidth: 5,
        barGap: "-100%",
        data: salvProMax,
        itemStyle: {
          normal: {
            color: "#000",
            barBorderRadius: 5,
          },
        },
        z: 1,
      },
    ],
  };
  if (initOption && typeof initOption === "object") { //滚动主要代码
    // 图表初始化配置
    chartInstance.value.setOption(initOption);
    // 定时自动滚动
    setInterval(function () {
      if (initOption.dataZoom[0].endValue == salvProValue.length) {
        initOption.dataZoom[0].endValue = 4;
        initOption.dataZoom[0].startValue = 0;
      } else {
        initOption.dataZoom[0].endValue = initOption.dataZoom[0].endValue + 1;
        initOption.dataZoom[0].startValue =
          initOption.dataZoom[0].startValue + 1;
      }
      chartInstance.value.setOption(initOption);
    }, 2000);
  }