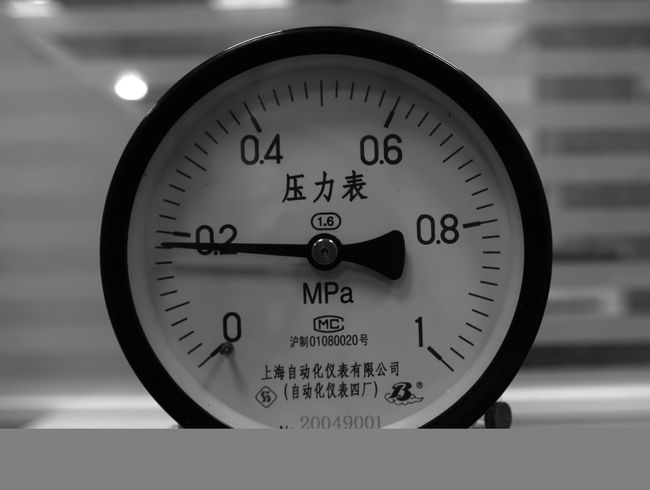
1.关键点平移数据增强
# 关键点数据增强
from PIL import Image, ImageDraw
import random
import json
from pathlib import Path

# 创建一个黑色背景图像
width, height = 5000, 5000  # 图像宽度和高度
background_color = (0, 0, 0)  # 黑色填充

# 随机分布图像
num_images = 1  # 要随机分布的图像数量
folder_path = Path("E:/2") # 测试图像目录
output_path = Path("E:/5") # 输出图像目录
for file in folder_path.rglob("*.jpg"):
        # eg: file = "目录名/123.jpg",file_name = "123.jpg"
        file_name = file.name
        image_origin = Image.open(file)
        width_origin,height_origin = image_origin.size

        for _ in range(num_images):
                #随机选择图像的位置
                x = random.randint(0, width - width_origin)
                y = random.randint(0, height - height_origin)
                print(x,y)

                canvas = Image.new("RGB", (width,height), background_color) #新建一个mask,全黑填充
                canvas.paste(image_origin, (x,y)) #将原图从(x,y)处粘贴到mask上

                Path.mkdir(output_path, exist_ok=True)
                img_name = 'a' + '_' + file_name #改变增强后图片的名字
                canvas.save(output_path / img_name)

                jsonFile = file.with_suffix(".json")
                print(jsonFile)
                if Path.exists(jsonFile): #判断图片是否有对应的json文件
                        print(f"找到{file}的Json文件")
                        with open(jsonFile, "r", encoding="utf-8") as f:
                                objectDict = json.load(f)
                        objectDict["imageData"] =  None # 清空json文件里加密的imgdata

                        objectDict["imageHeight"] = height
                        objectDict["imageWidth"] = width

                        json_name = 'a' + '_' + jsonFile.name #改变增强后json文件的名字

                        for i in range(len(objectDict["shapes"])):
                                if objectDict["shapes"][i]["shape_type"] in ["rectangle","line"]: #矩形框、线段
                                        objectDict["shapes"][i]['points'][0][0]+=x
                                        objectDict["shapes"][i]['points'][0][1]+=y
                                        objectDict["shapes"][i]['points'][1][0]+=x
                                        objectDict["shapes"][i]['points'][1][1]+=y

                                if objectDict["shapes"][i]["shape_type"] in ["polygon"]: #多段线
                                        for polygonMat in objectDict["shapes"][i]['points']:
                                                polygonMat[0]+=x
                                                polygonMat[1]+=y

                                if objectDict["shapes"][i]["shape_type"] in ["point"]: #关键点
                                        objectDict["shapes"][i]['points'][0][0]+=x
                                        objectDict["shapes"][i]['points'][0][1]+=y

                        with open(output_path / json_name, 'w',encoding='utf-8') as f:
                                json.dump(objectDict, f)

                else:
                        print("没有Json文件")
2.关键点旋转数据增强
from PIL import Image
import random
import json
from pathlib import Path
import numpy as np


def calc(center, radius):
    print(center)
    return [[center[0][0] - radius, center[0][1] - radius],
            [center[0][0] + radius, center[0][1] + radius]]


folder_path = Path("E:/2") # 原图片和json文件夹目录
output_path = Path("E:\dataset1") # 输出目录(包含img和json)

centerAnno = '6' # 定义圆心标注点,只能有一个
radius = 1430 # 通过radius和圆心centerAnno生成矩形框

for file in folder_path.rglob("*.jpg"):
        file_name = file.name
        file_name1 = 'r9' + '_' + file_name #改变增强后图片的名字

        image_origin = Image.open(file)
        width_origin,height_origin = image_origin.size

        angle = random.randint(-10, 10) #设置随机旋转范围
        print(angle)
        rotate_img = image_origin.rotate(angle)

        Path.mkdir(output_path, exist_ok=True)
        rotate_img.save(output_path / file_name1)

        jsonFile = file.with_suffix(".json")
        jsonFile1 =  'r9' + '_' + jsonFile.name #改变增强后json文件的名字

        print(jsonFile)
        if Path.exists(jsonFile):
            print(f"找到{file}的Json文件")
            with open(jsonFile, "r", encoding="utf-8") as f:
                objectDict = json.load(f)

            objectDict["imageData"] =  None # 清空json文件里加密的imgdata

            rad = np.pi / 180 * angle
            print(rad)

            rot_matrix = np.array([[np.cos(rad), -np.sin(rad)],
                                   [np.sin(rad), np.cos(rad)]])

            for shape in objectDict["shapes"]:
                if shape["shape_type"] in ["line"]:
                    x1, y1 = np.dot([shape['points'][0][0] - width_origin /2, shape['points'][0][1] - height_origin /2], rot_matrix)
                    x2, y2 = np.dot([shape['points'][1][0] - width_origin /2, shape['points'][1][1] - height_origin /2], rot_matrix)

                    shape['points'][0][0] = x1 + width_origin /2
                    shape['points'][0][1] = y1 + height_origin /2
                    shape['points'][1][0] = x2 + width_origin /2
                    shape['points'][1][1] = y2 + height_origin /2

                if shape["shape_type"] in ["polygon"]:
                    for polygonMat in shape['points']:
                        x1, y1 = np.dot([polygonMat[0] - width_origin /2, polygonMat[1] - height_origin /2], rot_matrix)
                        polygonMat[0] = x1 + width_origin /2
                        polygonMat[1] = y1 + height_origin /2
                if shape["shape_type"] in ["point"]:
                    x1, y1 = np.dot([shape['points'][0][0] - width_origin /2, shape['points'][0][1] - height_origin /2], rot_matrix)
                    shape['points'][0][0] = x1 + width_origin /2
                    shape['points'][0][1] = y1 + height_origin /2

            # 找到圆心标注框,只能有一个
            for shape in objectDict["shapes"]:
                if shape["label"] == centerAnno:
                    centerPoint = shape["points"]

            for shape in objectDict["shapes"]:
                if shape["shape_type"] == "rectangle":
                    [shape["points"][0], shape["points"][1]] = calc(centerPoint, radius)
                    print(centerPoint)
                    print(shape["points"][0], shape["points"][1])


            with open(output_path / jsonFile1, 'w',encoding='utf-8') as f:
                json.dump(objectDict, f)


        else:
            print("没有Json文件")
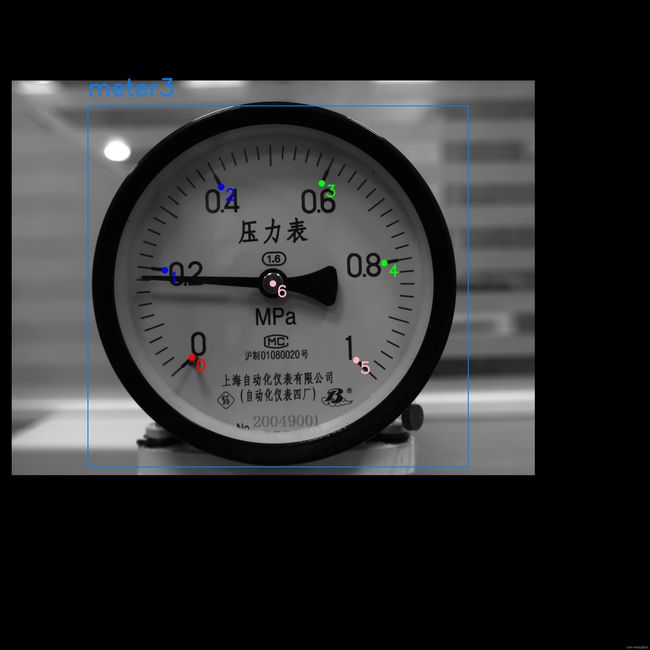
3.关键点可视化
# 可视化关键点位置
import cv2
from pathlib import Path
import json
import matplotlib.pyplot as plt

folder_path = Path("E:/2_1") # 原图及json文件夹
output_path = Path("E:/2_2") # 可视化图片输出文件夹

# 载入图像
for img_path in folder_path.rglob("*.jpg"):
    print(img_path)
    file_name = img_path.name
    img_bgr = cv2.imread(str(img_path))

# 载入labelme格式的json标注文件
    labelme_path = img_path.with_suffix(".json")
    print(labelme_path)
# labelme_path = 'meter_6_25.json'

    with open(labelme_path, 'r', encoding='utf-8') as f:
        labelme = json.load(f)

# 查看标注信息  rectangle:矩形  point:点  polygon:多边形
# print(labelme.keys())
# dict_keys(['version', 'flags', 'shapes', 'imagePath', 'imageData', 'imageHeight', 'imageWidth'])
# print(labelme['shapes'])

    # <<<<<<<<<<<<<<<<<<可视化框(rectangle)标注>>>>>>>>>>>>>>>>>>>>>
    # 框可视化配置
    bbox_color = (255, 129, 0)           # 框的颜色
    bbox_thickness = 5                   # 框的线宽

    # 框类别文字
    bbox_labelstr = {
        'font_size':6,         # 字体大小
        'font_thickness':14,   # 字体粗细
        'offset_x':0,          # X 方向,文字偏移距离,向右为正
        'offset_y':-80,       # Y 方向,文字偏移距离,向下为正
    }
    # 画框
    for each_ann in labelme['shapes']:  # 遍历每一个标注

        if each_ann['shape_type'] == 'rectangle':  # 筛选出框标注

            # 框的类别
            bbox_label = each_ann['label']
            # 框的两点坐标
            bbox_keypoints = each_ann['points']
            bbox_keypoint_A_xy = bbox_keypoints[0]
            bbox_keypoint_B_xy = bbox_keypoints[1]
            # 左上角坐标
            bbox_top_left_x = int(min(bbox_keypoint_A_xy[0], bbox_keypoint_B_xy[0]))
            bbox_top_left_y = int(min(bbox_keypoint_A_xy[1], bbox_keypoint_B_xy[1]))
            # 右下角坐标
            bbox_bottom_right_x = int(max(bbox_keypoint_A_xy[0], bbox_keypoint_B_xy[0]))
            bbox_bottom_right_y = int(max(bbox_keypoint_A_xy[1], bbox_keypoint_B_xy[1]))

            # 画矩形:画框
            img_bgr = cv2.rectangle(img_bgr, (bbox_top_left_x, bbox_top_left_y), (bbox_bottom_right_x, bbox_bottom_right_y),
                                    bbox_color, bbox_thickness)

            # 写框类别文字:图片,文字字符串,文字左上角坐标,字体,字体大小,颜色,字体粗细
            img_bgr = cv2.putText(img_bgr, bbox_label, (
                                  bbox_top_left_x + bbox_labelstr['offset_x'],
                                  bbox_top_left_y + bbox_labelstr['offset_y']),
                                  cv2.FONT_HERSHEY_SIMPLEX, bbox_labelstr['font_size'], bbox_color,
                                  bbox_labelstr['font_thickness'])


    # <<<<<<<<<<<<<<<<<<可视化关键点(keypoint)标注>>>>>>>>>>>>>>>>>>>>>
    # 关键点的可视化配置
    # 关键点配色
    kpt_color_map = {
        '0': {'name': '0', 'color': [0, 0, 255], 'radius': 25, 'thickness':-1},
        '1': {'name': '1', 'color': [255, 0, 0], 'radius': 25, 'thickness':-1},
        '2': {'name': '2', 'color': [255, 0, 0], 'radius': 25, 'thickness':-1},
        '3': {'name': '3', 'color': [0, 255, 0], 'radius': 25, 'thickness':-1},
        '4': {'name': '4', 'color': [0, 255, 0], 'radius': 25, 'thickness':-1},
        '5': {'name': '5', 'color': [193, 182, 255], 'radius': 25, 'thickness':-1},
        '6': {'name': '6', 'color': [193, 182, 255], 'radius': 25, 'thickness':-1},
        # '7': {'name': '7', 'color': [16, 144, 247], 'radius': 25},
        # '8': {'name': '8', 'color': [16, 144, 247], 'radius': 25},
    }

    # 点类别文字
    kpt_labelstr = {
        'font_size':4,             # 字体大小
        'font_thickness':12,       # 字体粗细
        'offset_x':30,             # X 方向,文字偏移距离,向右为正
        'offset_y':100,            # Y 方向,文字偏移距离,向下为正
    }

    # 画点
    for each_ann in labelme['shapes']:  # 遍历每一个标注
        if each_ann['shape_type'] == 'point':  # 筛选出关键点标注
            kpt_label = each_ann['label']  # 该点的类别
            # 该点的 XY 坐标
            kpt_xy = each_ann['points'][0]
            kpt_x, kpt_y = int(kpt_xy[0]), int(kpt_xy[1])
            # 该点的可视化配置
            kpt_color = kpt_color_map[kpt_label]['color']  # 颜色
            kpt_radius = kpt_color_map[kpt_label]['radius']  # 半径
            kpt_thickness = kpt_color_map[kpt_label]['thickness']  # 线宽(-1代表填充)
            # 画圆:画该关键点
            img_bgr = cv2.circle(img_bgr, (kpt_x, kpt_y), kpt_radius, kpt_color, kpt_thickness)
            # 写该点类别文字:图片,文字字符串,文字左上角坐标,字体,字体大小,颜色,字体粗细
            img_bgr = cv2.putText(img_bgr, kpt_label, (kpt_x + kpt_labelstr['offset_x'], kpt_y + kpt_labelstr['offset_y']),
                                  cv2.FONT_HERSHEY_SIMPLEX, kpt_labelstr['font_size'], kpt_color,
                                  kpt_labelstr['font_thickness'])


    # # <<<<<<<<<<<<<<<<<<可视化多段线(polygon)标注>>>>>>>>>>>>>>>>>>>>>
    # # 多段线的可视化配置
    # poly_color = (151, 57, 224)
    # poly_thickness = 3
    #
    # poly_labelstr = {
    #     'font_size':4,          # 字体大小
    #     'font_thickness':12,    # 字体粗细
    #     'offset_x':-200,        # X 方向,文字偏移距离,向右为正
    #     'offset_y':0,           # Y 方向,文字偏移距离,向下为正
    # }
    #
    # # 画多段线
    # img_mask = np.ones(img_bgr.shape, np.uint8) #创建一个和img_bgr一样大小的黑色mask
    #
    # for each_ann in labelme['shapes']:  # 遍历每一个标注
    #
    #     if each_ann['shape_type'] == 'polygon':  # 筛选出多段线(polygon)标注
    #
    #         poly_label = each_ann['label']  # 该多段线的类别
    #
    #         poly_points = [np.array(each_ann['points'], np.int32).reshape((-1, 1, 2))]  #reshape后增加一个维度
    #
    #         # 该多段线平均 XY 坐标,用于放置多段线类别文字
    #         x_mean = int(np.mean(poly_points[0][:, 0, :][:, 0])) #取出所有点的x坐标并求平均值
    #         y_mean = int(np.mean(poly_points[0][:, 0, :][:, 1])) #取出所有点的y坐标并求平均值
    #
    #         # 画该多段线轮廓
    #         img_bgr = cv2.polylines(img_bgr, poly_points, isClosed=True, color=poly_color, thickness=poly_thickness)
    #
    #         # 画该多段线内部填充
    #         img_mask = cv2.fillPoly(img_mask, poly_points, color=poly_color) #填充的颜色为color=poly_color
    #
    #         # 写该多段线类别文字:图片,文字字符串,文字左上角坐标,字体,字体大小,颜色,字体粗细
    #         img_bgr = cv2.putText(img_bgr, poly_label,
    #                               (x_mean + poly_labelstr['offset_x'], y_mean + poly_labelstr['offset_y']),
    #                               cv2.FONT_HERSHEY_SIMPLEX, poly_labelstr['font_size'], poly_color,
    #                               poly_labelstr['font_thickness'])

    # opacity = 0.8 # 透明度,越大越接近原图
    # img_bgr = cv2.addWeighted(img_bgr, opacity, img_mask, 1-opacity, 0)

    # 可视化
    # plt.imshow(img_bgr[:,:,::-1]) # 将bgr通道转换成rgb通道
    # plt.show()

    # 可视化多段线填充效果
    # plt.imshow(img_mask[:, :, ::-1])  # 将bgr通道转换成rgb通道
    # plt.show()

    # 当前目录下保存可视化结果
    cv2.imwrite(str(output_path) + '/' + file_name, img_bgr)


4.json2txt(用YOLOV8进行关键点训练)
#将坐标框、关键点、线段的json标注转换为txt
import os
import json
import shutil
import numpy as np
from tqdm import tqdm

# 框的类别
bbox_class = {
    'meter3':0
}
# 关键点的类别,注意按顺序写
keypoint_class = ['0','1','2','3','4','5','6','7','8']

path = 'E:/6' #json文件存放路径
save_folder='E:/7' #转换后的txt文件存放路径

# 定义单个json文件的转换
def process_single_json(labelme_path, save_folder):
    with open(labelme_path, 'r', encoding='utf-8') as f:
        labelme = json.load(f)

    img_width = labelme['imageWidth']  # 图像宽度
    img_height = labelme['imageHeight']  # 图像高度

    # 生成 YOLO 格式的 txt 文件
    suffix = labelme_path.split('.')[-2]
    # print(suffix)
    yolo_txt_path = suffix + '.txt'
    # print(yolo_txt_path)

    with open(yolo_txt_path, 'w', encoding='utf-8') as f:

        for each_ann in labelme['shapes']:  # 遍历每个标注

            if each_ann['shape_type'] == 'rectangle':  # 每个框,在 txt 里写一行

                yolo_str = ''

                # 框的信息
                # 框的类别 ID
                bbox_class_id = bbox_class[each_ann['label']]
                yolo_str += '{} '.format(bbox_class_id)
                # 左上角和右下角的 XY 像素坐标
                bbox_top_left_x = int(min(each_ann['points'][0][0], each_ann['points'][1][0]))
                bbox_bottom_right_x = int(max(each_ann['points'][0][0], each_ann['points'][1][0]))
                bbox_top_left_y = int(min(each_ann['points'][0][1], each_ann['points'][1][1]))
                bbox_bottom_right_y = int(max(each_ann['points'][0][1], each_ann['points'][1][1]))
                # 框中心点的 XY 像素坐标
                bbox_center_x = int((bbox_top_left_x + bbox_bottom_right_x) / 2)
                bbox_center_y = int((bbox_top_left_y + bbox_bottom_right_y) / 2)
                # 框宽度
                bbox_width = bbox_bottom_right_x - bbox_top_left_x
                # 框高度
                bbox_height = bbox_bottom_right_y - bbox_top_left_y
                # 框中心点归一化坐标
                bbox_center_x_norm = bbox_center_x / img_width
                bbox_center_y_norm = bbox_center_y / img_height
                # 框归一化宽度
                bbox_width_norm = bbox_width / img_width
                # 框归一化高度
                bbox_height_norm = bbox_height / img_height

                yolo_str += '{:.5f} {:.5f} {:.5f} {:.5f} '.format(bbox_center_x_norm, bbox_center_y_norm,
                                                                  bbox_width_norm, bbox_height_norm)

                ## 找到该框中所有关键点,存在字典 bbox_keypoints_dict 中
                bbox_keypoints_dict = {}
                for each_ann in labelme['shapes']:  # 遍历所有标注
                    if each_ann['shape_type'] == 'point':  # 筛选出关键点标注
                        # 关键点XY坐标、类别
                        x = int(each_ann['points'][0][0])
                        y = int(each_ann['points'][0][1])
                        label = each_ann['label']
                        if (x > bbox_top_left_x) & (x < bbox_bottom_right_x) & (y < bbox_bottom_right_y) & \
                                (y > bbox_top_left_y):  # 筛选出在该个体框中的关键点
                            bbox_keypoints_dict[label] = [x, y]

                    if each_ann['shape_type'] == 'line':  # 筛选出线段标注
                        # 起点XY坐标、类别
                        x0 = int(each_ann['points'][0][0])
                        y0 = int(each_ann['points'][0][1])
                        label = each_ann['label']
                        bbox_keypoints_dict[label] = [x0, y0]
                        # 终点XY坐标、类别
                        x1 = int(each_ann['points'][1][0])
                        y1 = int(each_ann['points'][1][1])
                        label = int(each_ann['label']) + 1 #将字符串转为整形,并+1,代表最后一个点
                        label = str(label) #将整型转为字符串
                        bbox_keypoints_dict[label] = [x1, y1]
                # print(bbox_keypoints_dict)

                        # if (x > bbox_top_left_x) & (x < bbox_bottom_right_x) & (y < bbox_bottom_right_y) & \
                        #         (y > bbox_top_left_y):  # 筛选出在该个体框中的关键点
                        #     bbox_keypoints_dict[label] = [x, y]

                ## 把关键点按顺序排好
                for each_class in keypoint_class:  # 遍历每一类关键点
                    if each_class in bbox_keypoints_dict:
                        keypoint_x_norm = bbox_keypoints_dict[each_class][0] / img_width
                        keypoint_y_norm = bbox_keypoints_dict[each_class][1] / img_height

                        yolo_str += '{:.5f} {:.5f} {} '.format(keypoint_x_norm, keypoint_y_norm, 2)  # 2可见不遮挡 1遮挡 0没有点
                    else:  # 不存在的点,一律为0
                        # yolo_str += '0 0 0 '.format(keypoint_x_norm, keypoint_y_norm, 0)
                        yolo_str += '0 0 0 '
                        # yolo_str += ' '
                # 写入 txt 文件中
                f.write(yolo_str + '\n')

    shutil.move(yolo_txt_path, save_folder) #从yolo_txt_path文件夹中移动到save_folder文件夹中
    # print('{} --> {} 转换完成'.format(labelme_path, yolo_txt_path))


# json2txt
for labelme_path0 in os.listdir(path):
    labelme_path = path + '/' + labelme_path0
    print(labelme_path)
    process_single_json(labelme_path, save_folder)
print('YOLO格式的txt标注文件已保存至 ', save_folder)


