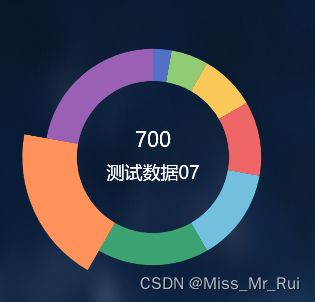
echarts饼图自动轮巡
可以设置轮询时间
鼠标移入停止轮询
鼠标移出自动开始轮询
可以设置渐变颜色
<template>
  <div class="line_chart h-full w-full">
    <div id="main" style="width: 300px; height: 300px; position: relative; float: left"></div>
  </div>
</template>
<script lang="ts" setup>
  import { ref, nextTick } from 'vue';
  import * as echarts from 'echarts';
  nextTick(() => {
    const getInfo = () => {
      let chartDom: any = document.getElementById('main');
      let myChart = echarts.init(chartDom);
      const option = ref<any>({
        series: [
          {
            name: 'Access From',
            type: 'pie',
            radius: ['45%', '64%'], // 通过设置内径与外径将饼图变为圆环饼图
            itemStyle: {
              borderRadius: 0, // 设置圆环的圆角弧度
              //此处注释放开可以设置饼图渐变色
              // color: (list) => {
              // 这里的渐进色数组一定要大于等于data的长度,不然会找不到对应得颜色而报错
              //   var colorList = [
              //     {
              //       colorStart: '#1F7EFF',
              //       colorEnd: '#B0D2FF',
              //     },
              //     {
              //       colorStart: '#FF65D3',
              //       colorEnd: '#FFD1F2',
              //     },
              //     {
              //       colorStart: '#00AFFF',
              //       colorEnd: '#9ADFFF',
              //     },
              //     {
              //       colorStart: '#7FF0FF',
              //       colorEnd: '#00E1FF',
              //     },
              //     {
              //       colorStart: '#FFB0B0',
              //       colorEnd: '#FF5454',
              //     },
              //     {
              //       colorStart: '#FFEFBE',
              //       colorEnd: '#FFD961',
              //     },
              //     {
              //       colorStart: '#FF9946',
              //       colorEnd: '#FFE4CD',
              //     },
              //     {
              //       colorStart: '#678AF7',
              //       colorEnd: '#C2D1FF',
              //     },
              //   ];
              //   return new echarts.graphic.LinearGradient(1, 0, 0, 0, [
              //     {
              //       //左、下、右、上
              //       offset: 0,
              //       color: colorList[list.dataIndex]['colorStart'],
              //     },
              //     {
              //       offset: 1,
              //       color: colorList[list.dataIndex]['colorEnd'],
              //     },
              //   ]);
              // },
            },
            emphasis: {
              // 设置高亮时显示标签
              label: {
                show: true,
              },
              scale: true, // 设置高亮时放大图形
              scaleSize: 20,
            },
            label: {
              // 设置图形标签样式
              show: false, // 未高亮时不显示标签,否则高亮时显示的标签会与静态的标签重叠
              position: 'center',
              // 设置标签展示内容,其中{d}、{b}为echarts标签内容格式器
              formatter: '{d_style|{c}}\n\n{b_style|{b}}',
              // 为标签内容指定样式,只能设置series-pie.label支持的样式
              rich: {
                d_style: {
                  fontSize: 18,
                  color: '#fff',
                },
                b_style: {
                  fontSize: 16,
                  color: '#fff',
                },
              },
            },
            data: [
              // 饼图数据
              {
                name: '测试数据01',
                value: '100',
              },
              {
                name: '测试数据02',
                value: '200',
              },
              {
                name: '测试数据03',
                value: '300',
              },
              {
                name: '测试数据04',
                value: '400',
              },
              {
                name: '测试数据05',
                value: '500',
              },
              {
                name: '测试数据06',
                value: '600',
              },
              {
                name: '测试数据07',
                value: '700',
              },
              {
                name: '测试数据08',
                value: '800',
              },
            ],
          },
        ],
      });
      option.value && myChart.setOption(option.value);
      // ----------------------------处理自动轮询逻辑开始----------------------------------------
      const selectPie = () => {
        // 高亮效果切换到下一个图形
        var dataLen = option.value.series[0].data.length;
        currentIndex = (currentIndex + 1) % dataLen;
        highlightPie();
      };
      let currentIndex = -1; // 当前高亮图形在饼图数据中的下标
      let changePieInterval = setInterval(selectPie, 1500); // 设置自动切换高亮图形的定时器
      const highlightPie = () => {
        // 取消所有高亮并高亮当前图形
        // 遍历饼图数据,取消所有图形的高亮效果
        for (var idx in option.value.series[0].data)
          myChart.dispatchAction({
            type: 'downplay',
            seriesIndex: 0,
            dataIndex: idx,
          });
        // 高亮当前图形
        myChart.dispatchAction({
          type: 'highlight',
          seriesIndex: 0,
          dataIndex: currentIndex,
        });
      };
      myChart.on('mouseover', (params) => {
        // 用户鼠标悬浮到某一图形时,停止自动切换并高亮鼠标悬浮的图形
        clearInterval(changePieInterval);
        currentIndex = params.dataIndex;
        highlightPie();
      });

      myChart.on('mouseout', () => {
        // 用户鼠标移出时,重新开始自动切换
        if (changePieInterval) clearInterval(changePieInterval);
        changePieInterval = setInterval(selectPie, 1500);
      });
      // --------------------------------------------------------------------
    };
    getInfo();
  });
</script>
