华为云云耀云服务器 L 实例评测|配置教程 + 用 Python 简单绘图
文章目录
- Part.I Introduction
-
- Chap.I 云耀云服务器 L 实例简介
- Chap.II 参与活动步骤
- Part.II 配置
-
- Chap.I 初步配置
- Chap.II 配置安全组
- Part.III 简单使用
-
- Chap.I VScode 远程连接华为云
- Chap.II 简单绘图
- Reference
Part.I Introduction
本篇博文是为了参与华为“【有奖征文】华为云云服务器焕新上线,快来亲身感受评测吧!”活动 1,顺便免费体验一下华为云平台。
Chap.I 云耀云服务器 L 实例简介
云耀云服务器 L 实例是新一代开箱即用、面向中小企业和开发者打造的全新轻量应用云服务器。云耀云服务器 L 实例提供丰富严选的应用镜像,实现应用一键部署,助力客户便捷高效的在云端构建电商网站、Web应用、小程序、学习环境、各类开发测试等 2。
Chap.II 参与活动步骤
步骤如下:
- 首先在『华为云平台』注册账号
- 填写问卷,填问卷需要华为云 ID,就是你的账号名(如果有租户就是租户名)
- 等待几天会收到满 ¥55 减 ¥54.99 的优惠券
- 去 网址 用优惠券花 3 分钱买一个月的『Linux 可视化宝塔面板』

- 购买完成之后依次点击『顶部菜单』→『资源』→『我的资源』→『侧边菜单』→『弹性云服务器』就可以看到自己购买的服务了

注:宝塔 Linux 面板 8.0.0.1:2核2G|系统盘 40GiB|流量包 400GB|峰值带宽 3Mbit/s
Part.II 配置
Chap.I 初步配置
- 首先需要设置密码:点击上面的『重置密码』(因为是第一次使用,所以要设置密码),设置好之后就可以使用啦~
- 在终端中输入
ssh [email protected](后面的 IP 是公网 IP,就是上面图片中第一行的 IP) - 然后输入密码就可以登进去了

免密登录:因为每次登录都需要输入密码,这样不免很烦,可以参考 3 实现免密登录。下面简单介绍一下步骤:
1、cd ~/.ssh/进入ssh所在目录
2、ssh-keygen -t rsa 生成公私钥,一路回车
3、将公钥拷贝到服务器上,并将其追加到服务器上./.ssh/authorized_keys中
4、更改服务器上的.ssh权限
chmod 700 ~/.ssh/
chmod 600 ~/.ssh/authorized_keys
5、在本地.ssh/config文件中加入 a1 (这步好像没必要?这是用 VScode 才需要的步骤)
Host haoJiDeMingZi 								# sui bian qu
    HostName 111.111.1.1 		 				#(IP)
    User usrname                	  			# username
    IdentityFile /Users/xxx/.ssh/id_rsa			# si yao di zhi
6、在终端输入
ssh somebody@ip
# eg:
ssh [email protected]
即可免密连接!
Chap.II 配置安全组
说实话,笔者之前没有做过这种操作,是看了一个大佬的文章 4 才意识到要这么做。
进行安全组规则设置是为了保证来自外部操作来链接服务器的安全性,使用服务器时,服务器会提供(一般一个服务器上最多能监听65535个端口)端口,让外部接入服务器进行操作,对进行安全组配置就是对每一个端口设置开放与否
进入安全组配置的方法:依次点击『顶部菜单』→『资源』→『我的资源』→『侧边菜单』→『弹性云服务器』→最右边『更多』→最下面『网络设置』→『安全组规则配置』→『配置』规则→可以进行修改、复制等操作。可以看到华为云的安全配置里面已经有默认的几个安全组规则,可以查看后自行选用,当然不满意的话也可以自己新建。
Part.III 简单使用
就把这个云服务器当作一个 Linux 系统的电脑使用就行了(虽然利用它还可以搭建网站等等,具体笔者也没有尝试过)。里面已经安装了 Python
root@hcss-ecs-903f:~# python3 -V
Python 3.10.6
Chap.I VScode 远程连接华为云
虽然使用 powershell 已经可以很方便地和华为云建立远程连接,但是在编程的过程中,使用 Linux 终端不免有些麻烦。因为笔者习惯用 VScode,它既可以配置语言解释器(在编程的过程中会提示错误信息),也可以像 Windows 那样很方便地浏览文件。下面就简单演示一下如何用 VScode 远程连接服务器 6。
步骤如下:
- 从官网下载 VScode
- 安装 Remote-SSH 插件
- 在
~\.ssh文件中添加服务器连接配置(其实上面免密登录第五步已经做了此操作) - 连接服务器(第一次连接需要进行一些配置,比如选择服务器是什么操作系统之类的)
连接好之后像笔者一样就可以尽情地玩耍了。

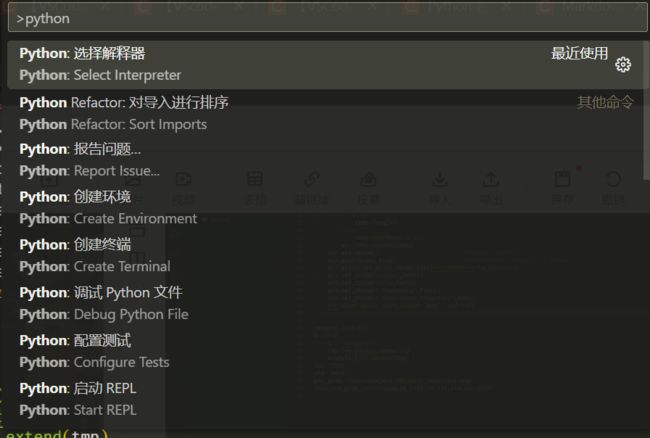
值得注意的是,当有多个 Python 时,可以Ctrl+Shift+P,输入python 选择你想要的解释器,当然第一次使用华为云就不需要考虑这点了
Chap.II 简单绘图
下面就用 Python 来画个图吧,首先需要安装matplotlib
pip install matplotlib
然后找一个合适的地方进行简单的测试,笔者新建了文件夹
mkdir project/20230915_test
然后新建一个文件
touch plot.py
将脚本贴进去
import numpy as np

def draw_cum_prob_curve(data,bins=20,title='Distribution Of Errors',xlabel='The Error(mm)',pic_path=''):
    """
    plot Probability distribution histogram and Cumulative probability curve.

    > @param[in] data:          The error data
    > @param[in] bins:          The number of hist
    > @param[in] title:         The titile of the figure
    > @param[in] xlabel:        The xlable name
    > @param[in] pic_path:      The path where you want to save the figure
    return:     void
    """
    import matplotlib.pyplot as plt
    import matplotlib as mpl
    from matplotlib.ticker import FuncFormatter
    from matplotlib.pyplot import MultipleLocator
    def to_percent(temp,position=0):          # convert float number to percent
        return '%1.0f'%(100*temp) + '%'
    fig, ax1 = plt.subplots(1, 1, figsize=(12, 6), dpi=100, facecolor='w')
    font1 = {'weight': 600, 'size': 15}

    n, bins, patches=ax1.hist(data,bins =bins, alpha = 0.65,edgecolor='k') # Probability distribution histogram
    yt=plt.yticks()
    yt1=yt[0].tolist()
    yt2=[i/sum(n) for i in yt1]
    ytk1=[to_percent(i) for i in yt2 ]
    plt.yticks(yt1,ytk1)
    X=bins[0:-1]+(bins[1]-bins[0])/2.0
    bins=bins.tolist()
    freq=[f/sum(n) for f in n]
    acc_freq=[]
    for i in range(0,len(freq)):
        if i==0:
            temp=freq[0]
        else:
            temp=sum(freq[:i+1])
        acc_freq.append(temp)
    ax2=ax1.twinx()                         # double ylable
    ax2.plot(X,acc_freq)                    # Cumulative probability curve
    ax2.yaxis.set_major_formatter(FuncFormatter(to_percent))
    ax1.set_xlabel(xlabel,font1)
    ax1.set_title(title,font1)
    ax1.set_ylabel('Frequency',font1)
    ax2.set_ylabel("Cumulative Frequency",font1)
    plt.savefig(pic_path,format='png', dpi=300)


example_list=[]
n=10000
for i in range(n):
    tmp=[np.random.normal()]
    example_list.extend(tmp)
tit='TEST'
xla='DATA'
pic_path='/root/project/20230915_test/test.png'		# file_save_path
draw_cum_prob_curve(example_list,50,tit,xla,pic_path)
按F5运行,就得到了绘图结果,如果想将绘图结果保存在本地,可以
scp [email protected]:/root/project/20230915_test/test.png ./
Reference
【有奖征文】华为云云服务器焕新上线,快来亲身感受评测吧! ↩︎
华为云云耀云服务器 L 实例 ↩︎ ↩︎
免密连接服务器 ↩︎
配置安全组 ↩︎
安全组配置示例 ↩︎
VScode 远程连接服务器 ↩︎


