使用python对光谱数据进行lorentz峰值拟合(bounds限定拟合参数范围)
1、lorentz峰值拟合
发光光谱是一种用于表征二维半导体材料光学性质的重要技术,它可以反映出材料中的载流子密度、缺陷态、激子束缚能等信息。
由于二维半导体材料的厚度极其薄,其发光信号往往很弱,且受到基底、环境和测量设备等因素的干扰,因此需要对发光光谱进行合理的数据处理和分析,以提取出准确和可靠的物理参数。
Lorentz峰值拟合是一种常用的数据处理方法,原理是假设每个峰值都是由一个或多个激子态产生的,每个激子态都可以用一个复数表示其能量和寿命,然后利用最小二乘法求解出最佳拟合参数,可以用来描述二维半导体材料发光谱的单个或者多个峰值,从而得到峰值位置、强度、宽度等参数。
对光谱进行Lorentz峰值拟合可以有效地提高数据质量和分析精度,能够更精确地确定激子峰的位置和强度,从而研究材料的特征。
函数形式如下:
L ( x ) = A π 1 2 Γ ( x − x 0 ) 2 + ( 1 2 Γ ) 2 L(x) = \frac{A}{\pi} \frac{\frac{1}{2}\Gamma}{(x-x_0)^2 + (\frac{1}{2}\Gamma)^2} L(x)=πA(x−x0)2+(21Γ)221Γ
其中,x是光谱的横坐标(波长或波数), x 0 x_0 x0是峰值的位置,A是峰值的幅度, Γ \Gamma Γ是峰值的半宽度(与峰值的展宽程度有关)。
拟合过程通过调节参数 x 0 x_0 x0、A和 Γ \Gamma Γ来使得lorentzian函数尽可能拟合实际的光谱峰值。
在实际的拟合过程中,可以用下面的简易形式:
L ( x ) = A Γ 2 ( x − x 0 ) 2 + Γ 2 L(x) = \frac{A\Gamma^2}{(x-x_0)^2 + \Gamma^2} L(x)=(x−x0)2+Γ2AΓ2
注意:我的csv文件,第一列为波长,第二列为光子数(光强)。
2、单峰拟合
# 在Python中,可以使用科学计算库SciPy来实现对光谱数据的Lorentz峰值拟合。
# 我们首先定义了一个Lorentzian函数,并生成了一个模拟的光谱数据,其中加入了一些随机噪声。
# 然后,我们使用curve_fit函数进行拟合,其中p0参数是初始猜测的参数。
# 最后,我们绘制了原始数据和拟合结果的图像,并打印出拟合得到的参数。

import numpy as np
import matplotlib.pyplot as plt
from scipy.optimize import curve_fit
import pandas as pd

# 定义Lorentzian函数
def lorentzian(x, x0, A, gamma):
    return A * gamma**2 / ((x - x0)**2 + gamma**2)

# # 生成模拟的光谱数据
# x_data = np.linspace(500, 700, 200)
# true_params = [600, 1000, 20]  # 真实的参数:x0:峰值位置; A:峰值幅度; gamma:峰值的半宽度
# y_data = lorentzian(x_data, *true_params) + np.random.normal(0, 50, len(x_data))  # 加入噪声
# wavelength = x_data
# intensity = y_data


# 读取光谱数据
file_path = r'your-path-of-csv'
data = pd.read_csv(file_path, header=None)

wavelength = data.iloc[:, 0]
intensity = data.iloc[:, 1]


# 进行拟合
'''
初始猜测的参数,根据实际数据和仿真结果对initial_guess进行调整
注意:如果遇到下面的错误:
RuntimeError: Optimal parameters not found: Number of calls to function has reached maxfev = 1400.
默认情况下curve_fit函数的最大迭代次数是1400次,如果出现这样的报错,
可以尝试提供更合理的初始猜测值,有时候初始猜测值不合适可能会导致拟合无法收敛。

要确保得到的 Lorentz 峰的基数为正值且为 0,可以在拟合参数中限制 A(峰值幅度)的范围。
在 curve_fit 函数中,使用 bounds 参数来限制拟合参数的范围。
设置一个较小的正数作为峰值幅度的下限,确保其为正值。

bounds 参数是一个包含两个元组的列表,每个元组表示一个参数的范围。
元组中的第一个值表示参数的下界(最小值),第二个值表示参数的上界(最大值)。
拟合算法会在这个范围内搜索最优的参数值。
'''

initial_guess = [1170, 100, 20]  # 初始猜测的参数:x0, A, gamma

# 设置参数范围
x0_lower_bound = 1100  # x0 的下界
x0_upper_bound = 1300  # x0 的上界
A_lower_bound = 0  # A 的下界,确保为正值
A_upper_bound = np.inf  # A 的上界,根据需要设置
gamma_lower_bound = 0  # gamma 的下界,可以为 0
gamma_upper_bound = np.inf  # gamma 的上界,根据需要设置

# 将参数范围转换为 bounds 参数格式
bounds = ([x0_lower_bound, A_lower_bound, gamma_lower_bound],
          [x0_upper_bound, A_upper_bound, gamma_upper_bound])
fit_params, _ = curve_fit(lorentzian, wavelength, intensity, p0=initial_guess, bounds=bounds)

# 绘制拟合结果
plt.plot(wavelength, intensity, label='Original Spectrum')
plt.plot(wavelength, lorentzian(wavelength, *fit_params), color='red', label='Fit peak: ' + "{:.1f}".format(fit_params[0]))
plt.legend()
plt.xlabel('Wavelength')
plt.ylabel('Intensity')
plt.title('Lorentzian Peak Fitting')
plt.show()

print('Fit parameters:', fit_params)
输出:
Fit parameters: [1173.7909121 117.90768115 18.34664239]
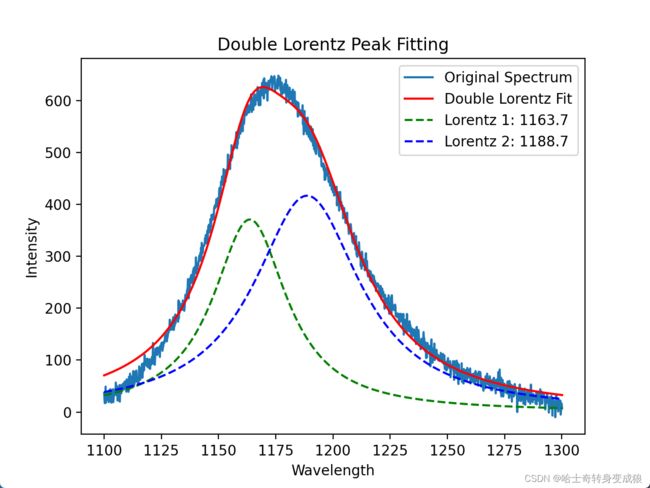
2、双峰拟合
在单峰的基础上增加一个双洛伦兹函数:
# 定义双Lorentzian函数作为拟合模型
def double_lorentzian(x, x1, A1, gamma1, x2, A2, gamma2):
    return lorentzian(x, x1, A1, gamma1) + lorentzian(x, x2, A2, gamma2)
然后再进行拟合:
fit_params, _ = curve_fit(double_lorentzian, wavelength, intensity, p0=initial_guess)
最后打印出结果:
Fit parameters: [1163.66742694  370.85710156   19.65005682 1188.70437071  416.71761075
   28.27593917]
如果不加上bounds的限定,可能会出现下面的情况:
Fit parameters: [1158.58048679  455.68236771   30.18819224 1138.46591814 -137.99431639
   54.30198123]

显然,lorentz峰值为负数并不符合预期、也不具有物理意义。
因此,需要针对拟合函数的形式加上bounds的限定:
# 设置参数范围
x0_lower_bound = 1100  # x0 的下界
x0_upper_bound = 1300  # x0 的上界
A_lower_bound = 0  # A 的下界,确保为正值
A_upper_bound = np.inf  # A 的上界,根据需要设置
gamma_lower_bound = 0  # gamma 的下界,可以为 0
gamma_upper_bound = np.inf  # gamma 的上界,根据需要设置

# 将参数范围转换为 bounds 参数格式
bounds = ([x0_lower_bound, A_lower_bound, gamma_lower_bound,
           x0_lower_bound, A_lower_bound, gamma_lower_bound],
          [x0_upper_bound, A_upper_bound, gamma_upper_bound,
           x0_upper_bound, A_upper_bound, gamma_upper_bound])

fit_params, _ = curve_fit(double_lorentzian, wavelength, intensity, p0=initial_guess, bounds=bounds)
得到的结果如下:
Fit parameters: [1155.27544155  241.21928542   15.87907758 1173.56139486  161.41922224
   22.41430758]


