Java笔记:Arthas-Java线上异常排查
一、安装
arthas在github上有个page,地址是https://alibaba.github.io/arthas/。
安装的方式有好几种:
1.直接下载一个可以启动的jar包然后用java -jar的方式启动
2.用官方提供的as.sh脚本一键安装
3.用rpm的方式安装
本篇介绍第一种方式,因为它简单而且想迁移的时候也超级方便(毕竟只需要把下载的jar包拷贝走就行了)。
curl -O https://alibaba.github.io/arthas/arthas-boot.jar
如果下载速度太慢,可以用gitee上的源
curl -O https://arthas.gitee.io/arthas-boot.jar
curl命令直接把arthas-boot.jar下载到你想要的目录
[root@localhost ~]# ll -lrt
-rw-r--r--. 1 root root   138880 Jun 22 02:55 arthas-boot.jar
二、启动
用java命令直接启动
root@zc-xichuan:~# java -jar arthas-boot.jar
[INFO] arthas-boot version: 3.4.5
[INFO] Found existing java process, please choose one and input the serial number of the process, eg : 1. Then hit ENTER.
* [1]: 7363 org.apache.zookeeper.server.quorum.QuorumPeerMain
  [2]: 15925 xichuan-api-0.0.1-SNAPSHOT.jar
  [3]: 5806 /root/xichuan/activeMQ/apache-activemq-5.12.2//bin/activemq.jar
  [4]: 15966 xichuan-web-0.0.1-SNAPSHOT.jar
但是这里没有进去,这是因为arthas在启动时会检测本机运行的jvm进程,然后让用户选择需要绑定的进程,后面的操作都是针对选定的进程的。
这里我先启动一个java应用,然后再启动arthas。
[root@localhost ~]# java -jar arthas-boot.jar
[INFO] arthas-boot version: 3.3.3
[INFO] Found existing java process, please choose one and input the serial number of the process, eg : 1. Then hit ENTER.
* [1]: 2467 jvm-0.0.1-SNAPSHOT.jar
下面就列出了本机正在运行的java进程,等待用户输入,这里输入1然后回车。如果是第一次启动需要下载一些必要的文件,等待下载完成即可。
[root@localhost arthas]# java -jar arthas-boot.jar
[INFO] arthas-boot version: 3.3.3
[INFO] Found existing java process, please choose one and input the serial number of the process, eg : 1. Then hit ENTER.
* [1]: 2467 jvm-0.0.1-SNAPSHOT.jar
  1
  [INFO] arthas home: /usr/local/arthas
  [INFO] Try to attach process 2467
  [INFO] Attach process 2467 success.
  [INFO] arthas-client connect 127.0.0.1 3658
  ,---.  ,------. ,--------.,--.  ,--.  ,---.   ,---.
  /  O  \ |  .--. ''--.  .--'|  '--'  | /  O  \ '   .-'
  |  .-.  ||  '--'.'   |  |   |  .--.  ||  .-.  |`.  `-.
  |  | |  ||  |\  \    |  |   |  |  |  ||  | |  |.-'    |
  `--' `--'`--' '--'   `--'   `--'  `--'`--' `--'`-----'


wiki      https://alibaba.github.io/arthas
tutorials https://alibaba.github.io/arthas/arthas-tutorials
version   3.3.3
pid       2467
time      2020-06-22 03:02:31

[arthas@2467]$
如果看到这个界面就表示启动并关联成功了。
三、help命令
在arthas交互环境中,可以输入help命令,然后会出现所有arthas支持的命令
[arthas@2467]$ help
NAME         DESCRIPTION
help         Display Arthas Help
keymap       Display all the available keymap for the specified connection.
sc           Search all the classes loaded by JVM
sm           Search the method of classes loaded by JVM
classloader  Show classloader info
jad          Decompile class
getstatic    Show the static field of a class
...
如果不知道命令的用法,可以输入相应的命令后加参数–help,比如可以看一下sc命令的用法
[arthas@2467]$ sc --help
USAGE:
sc [-c <value>] [-d] [-x <value>] [-f] [-h] [-E] class-pattern
SUMMARY:
Search all the classes loaded by JVM
EXAMPLES:
sc -d org.apache.commons.lang.StringUtils
sc -d org/apache/commons/lang/StringUtils
sc -d *StringUtils
sc -d -f org.apache.commons.lang.StringUtils
sc -E org\\.apache\\.commons\\.lang\\.StringUtils
WIKI:
https://alibaba.github.io/arthas/sc
OPTIONS:
-c, --classloader <value> The hash code of the special class's classLoader
-d, --details Display the details of class
-x, --expand Expand level of object (0 by default)
-f, --field Display all the member variables
-h, --help this help
-E, --regex Enable regular expression to match (wildcard matching by default)
Class name pattern, use either ' .' or '/' as separator
不仅会显示出命令是干嘛用的,命令的完整参数,还很贴心地提供了一些具体的例子,如果英语看不习惯,还可以到WIKI下面那个地址看官方文档,有中文版的。
四、用arthas解决上一篇的问题
4.1 cpu占用过高
用thread命令列出线程的信息
[arthas@2467]$ thread
Threads Total: 28, NEW: 0, RUNNABLE: 11, BLOCKED: 0, WAITING: 14, TIMED_WAITING: 3, TERMINATED: 0
ID         NAME                              GROUP                 PRIORITY   STATE      %CPU        TIME       INTERRUPTE DAEMON
16         http-nio-8080-exec-2              main                  5          RUNNABLE   99          0:25       false      true
29         Attach Listener                   system                9          RUNNABLE   0           0:0        false      true
11         Catalina-utility-1                main                  1          WAITING    0           0:0        false      false
12         Catalina-utility-2                main                  1          TIMED_WAIT 0           0:0        false      false
28         DestroyJavaVM                     main                  5          RUNNABLE   0           0:4        false      false
3          Finalizer                         system                8          WAITING    0           0:0        false      true
2          Reference Handler                 system                10         WAITING    0           0:0        false      true
这个命令会把所有线程按照cpu占用率从高到低列出来,如果线程太多,可以通过-n参数指定输出的行数。
输入thread -n 3会显示当前最忙的3个线程,可以用来排查线程CPU消耗
输入thread -b 会显示当前处于BLOCKED状态的线程,可以排查线程锁的问题
上面的输出结果可以看到id为16的这个线程cpu占用率很过,然后再通过thread加线程id输出改线程的栈信息
[arthas@2467]$ thread 16
"http-nio-8080-exec-2" Id=16 RUNNABLE
at com.spareyaya.jvm.service.EndlessLoopService.service(EndlessLoopService.java:19)
at com.spareyaya.jvm.controller.JVMController.endlessLoop(JVMController.java:30)
at sun.reflect.NativeMethodAccessorImpl.invoke0(Native Method)
at sun.reflect.NativeMethodAccessorImpl.invoke(NativeMethodAccessorImpl.java:62)
at sun.reflect.DelegatingMethodAccessorImpl.invoke(DelegatingMethodAccessorImpl.java:43)
...
两步就定位到了问题
4.2 死锁
还是用thread命令,参数是-b
[arthas@2997]$ thread -b
"Thread-3" Id=29 BLOCKED on java.lang.Object@3f20bf9 owned by "Thread-4" Id=30
at com.spareyaya.jvm.service.DeadLockService.service1(DeadLockService.java:27)
-  blocked on java.lang.Object@3f20bf9
-  locked java.lang.Object@2fea801a <---- but blocks 1 other threads!
at com.spareyaya.jvm.controller.JVMController.lambda$deadLock$0(JVMController.java:37)
at com.spareyaya.jvm.controller.JVMController$$Lambda$456/748979989.run(Unknown Source)
at java.lang.Thread.run(Thread.java:748)
这个命令和jstack工具检测死锁同样简单,不过个人认为jstack工具检测死锁其实要比这个更直观一些。
4.3 内存泄漏
这个我们可以用dashboard命令来实时展示当前应用的多线程状态、Jvm各区域、GC情况等信息

如果内容使用率在不断上升,而且gc后也不下降,后面还发现gc越来越频繁,很可能就是内存泄漏了。
这个时候我们可以直接用heapdump命令把内存快照dump出来,作用和jmap工具一样
[arthas@23581]$ heapdump --live /root/jvm.hprof
Dumping heap to /root/jvm.hprof...
Heap dump file created
然后把得到的dump文件导入eclipse,用MAT插件分析就行了。
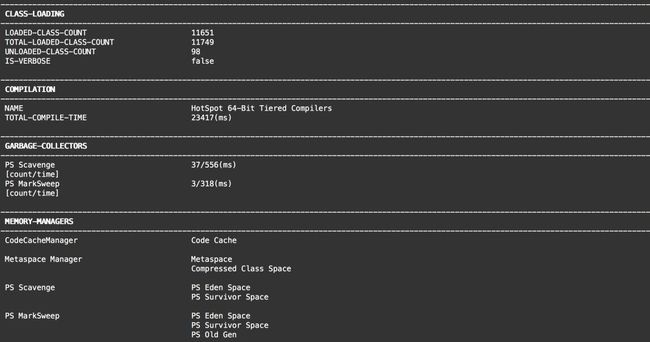
4.4 JVM监控
输入jvm,查看jvm详细的性能数据
4.5 函数耗时监控
通常说一个接口性能不好,其实就是接口响应时间比较长造成的,具体代码中哪个函数耗时比较长呢?可以使用trace功能来监控一下
trace -jcn.testfan.perf.beihe.pinter.http.CaseController time
解释:
-j参数可以过滤掉jdk自身的函数
cn.testfan.perf.beihe.pinter.http.CaseController是接口所在的类
time是接口的入口函数

通过圈起来的部分可以看到,接口的入口函数time总耗时371ms
其中getDataFromDb函数耗时200ms
getDataFromRedis函数耗时100ms
getDataFromOuter函数耗时50ms
process函数耗时20ms
很明显,最慢的函数已经找到了,接下里就要去对代码进行进一步分析,然后再进行优化。
五、arthas其它命令
arthas还提供了很多用于监控的命令,比如监控某个方法的执行时间,反编译线上的class文件,甚至在不重启java应用的情况下直接替换某个类。官方的使用文档已经写得太详细了,这里就不再一一介绍了,大家可以自己尝试。
其他常用到的命令:
# 反编译代码
jad --source-only com.fable.jsst.kettleBusiness.service.impl.KettleExtractDataServiceImpl > /tmp/KettleExtractDataServiceImpl.java

# 查询类加载器
sc -d *KettleExtractDataServiceImpl | grep classLoaderHash

# 重新编译代码(某些类使用了复杂的语法糖或是插件等属性,经常会遇到编译失败的情况,建议在本地ide里面编译好)
mc -c 1b40d5f0 /tmp/KettleExtractDataServiceImpl.java -d /tmp

# 热加载
redefine /usr/local/test/TaskMonitorServiceImpl.class

#watch 全限定类名 方法名 观察点 参数 ,     观察点:arthas定义了一系列的观察点:
watch com.fable.shzlsjcjjtj.lkyw.service.impl.LkywCollectorServiceImpl getLastSuccessTime returnObj