引言:在准备九月份的华为杯,入门选择了司守奎老师的教材《数学建模算法与应用》,书中仅提供了lingo和matlab的版本,但是python的数据处理能力更加出色,因此考虑在学习的过程中将代码全部用python实现。
第一章:线性规划
基础代码:(例题1.1)
'''
max z = 4x+3y
2x+y <= 10
x+y <= 8
y <= 7
x,y >= 0
'''
import numpy as np
from scipy.optimize import linprog
c = np.array([-4,-3])
A = np.array([[2,1],[1,1],[0,1]])
b = np.array([10,8,7])
x_bounds = (0,None)
y_bounds = (0,None)
res = linprog(c,A_ub=A,b_ub=b,bounds=[x_bounds,y_bounds])
print("Optimal value:", -res.fun)
print("Optimal value:",res.x)
基础代码:(例题1.2)
'''
max w = 2x+3y-5z
x+y+z = 7
2x-5y+z >= 10
x+3y+z <= 12
x,y,z >= 0
'''
import numpy as np
from scipy.optimize import linprog
c = np.array([-2,-3,5])
A = np.array([[-2,5,-1],[1,3,1]])
b = np.array([-10,12])
A_ = np.array([[1,1,1]])
b_ = np.array([7])
x_bounds = (0,None)
y_bounds = (0,None)
z_bounds = (0,None)
res = linprog(c,A_ub=A,b_ub=b,A_eq=A_,b_eq=b_,bounds=[x_bounds,y_bounds,z_bounds])
print("Optimal value:", -res.fun)
print("Optimal value:",res.x)
基础代码:(例题1.3)
'''
min w = 2x+3y+z
x+4y+2z >= 8
3x+2y >= 6
x,y,z >= 0
'''
import numpy as np
from scipy.optimize import linprog
c = np.array([2,3,1])
A = np.array([[-1,-4,-2],[-3,-2,0]])
b = np.array([-8,-6])
x_bounds = (0,None)
y_bounds = (0,None)
z_bounds = (0,None)
res = linprog(c,A_ub=A,b_ub=b,bounds=[x_bounds,y_bounds,z_bounds])
print("Optimal value:", res.fun)
print("Optimal value:",res.x)
基础代码:(例题1.5)
import numpy as np
from scipy.optimize import linprog
c = np.array([1,1,2,2,3,3,4,4])
A = np.array([[1,-1,-1,1,-1,1,1,-1],[1,-1,-1,1,1,-1,-3,3],[1,-1,-1,1,-2,2,3,-3]])
b = np.array([-2,-1,-1/2])
u1_bounds = (0,None)
u2_bounds = (0,None)
u3_bounds = (0,None)
u4_bounds = (0,None)
v1_bounds = (0,None)
v2_bounds = (0,None)
v3_bounds = (0,None)
v4_bounds = (0,None)
res = linprog(c,A_ub=A,b_ub=b,bounds=[u1_bounds,v1_bounds,u2_bounds,v2_bounds,u3_bounds,v3_bounds,u4_bounds,v4_bounds])
print("Optimal value:", res.fun)
print("Optimal value:",res.x)
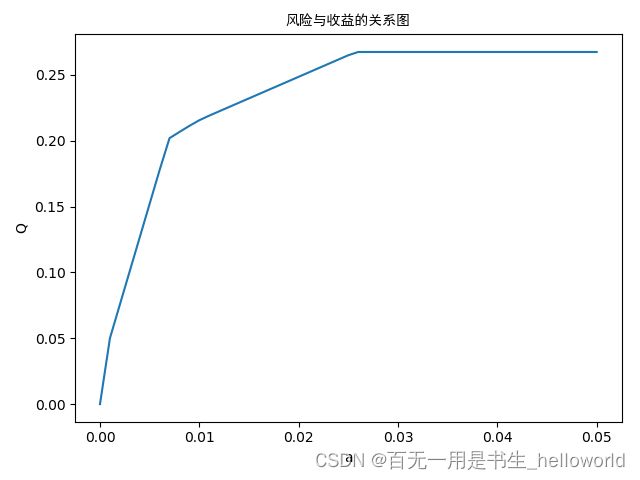
基础代码:(投资的收益与风险----------------模型一)
'''
模型一:固定风险水平 优化收益
'''
import numpy as np
from scipy.optimize import linprog
import matplotlib.pyplot as plt
def model(a):
c = np.array([-(0.05),-(0.28-0.01),-(0.21-0.02),-(0.23-0.045),-(0.25-0.065)])
A = np.array([[0,0.025,0,0,0],[0,0,0.015,0,0],[0,0,0,0.055,0],[0,0,0,0,0.026]])
b = np.array([a,a,a,a])
A_ = np.array([[(1),(1+0.01),(1+0.02),(1+0.045),(1+0.065)]])
b_ = np.array([1])
x1_bounds = (0,None)
x2_bounds = (0,None)
x3_bounds = (0,None)
x4_bounds = (0,None)
x5_bounds = (0,None)
res = linprog(c,A_ub=A,b_ub=b,A_eq =A_,b_eq=b_,bounds=[x1_bounds,x2_bounds,x3_bounds,x4_bounds,x5_bounds])
return -res.fun
def draw(x,y):
x = x
y = y
plt.plot(x, y)
plt.xlabel('a')
plt.ylabel('Q')
plt.title('风险与收益的关系图',fontproperties='SimHei')
plt.show()
if __name__ == '__main__':
a = 0;
x = [0];
y = [0];
while a < 0.05:
y_res = model(a)
a = a+0.001
x.append(a)
y.append(y_res)
draw(x,y)

- 思考:虽然根据关系图可以确定转折点的大致范围,但是怎么确定这个具体值是多少是个问题哎?而且步长为0.001,终止条件为0.05也是根据经验设定的吧,在开始的时候如果没有设定好【巧合值】的话可能连转折点都很难发现。
