【100天精通Python】Day67:Python可视化_Matplotlib 绘动画,2D、3D 动画 示例+代码
1 绘制2D动画(animation)
Matplotlib是一个Python绘图库,它提供了丰富的绘图功能,包括绘制动画。要绘制动画,Matplotlib提供了
FuncAnimation类,允许您创建基于函数的动画。下面是一个详细的Matplotlib动画示例,演示了如何创建一个简单的动画。
示例1:Matplotlib绘制一个简单的正弦波动画 :
import numpy as np
import matplotlib.pyplot as plt
from matplotlib.animation import FuncAnimation

# 创建一个空白图形
fig, ax = plt.subplots()

# 创建一个空白线条,稍后将在动画中更新
line, = ax.plot([], [], lw=2)

# 设置坐标轴范围
ax.set_xlim(0, 2*np.pi)
ax.set_ylim(-1, 1)

# 初始化函数,用于创建空白图形
def init():
    line.set_data([], [])
    return line,

# 动画更新函数,在每一帧中更新线条数据
def update(frame):
    x = np.linspace(0, 2*np.pi, 1000)
    y = np.sin(2*np.pi * (x - 0.01 * frame))
    line.set_data(x, y)
    return line,

# 创建动画对象,传递初始化函数和更新函数
ani = FuncAnimation(fig, update, frames=200, init_func=init, blit=True)

# 保存动画为gif文件(可选)
ani.save('sine_wave_animation.gif', writer='pillow', fps=30)

# 显示动画
plt.show()
这个示例演示了如何创建一个简单的正弦波动画。让我们分析一下代码:
我们首先导入必要的库,包括NumPy和Matplotlib中的
FuncAnimation类。创建一个图形对象(
fig)和一个坐标轴对象(ax),然后创建一个空白的线条对象(line)。设置坐标轴范围。
编写
init函数,它用于初始化图形,此处是清空线条。编写
update函数,它在每一帧中更新线条的数据。在这个示例中,我们绘制了一个在x轴上以不同速度移动的正弦波。创建
FuncAnimation对象,传递初始化函数、更新函数、帧数等参数。最后,您可以选择将动画保存为GIF文件(使用
ani.save)或直接在窗口中显示(使用plt.show())。
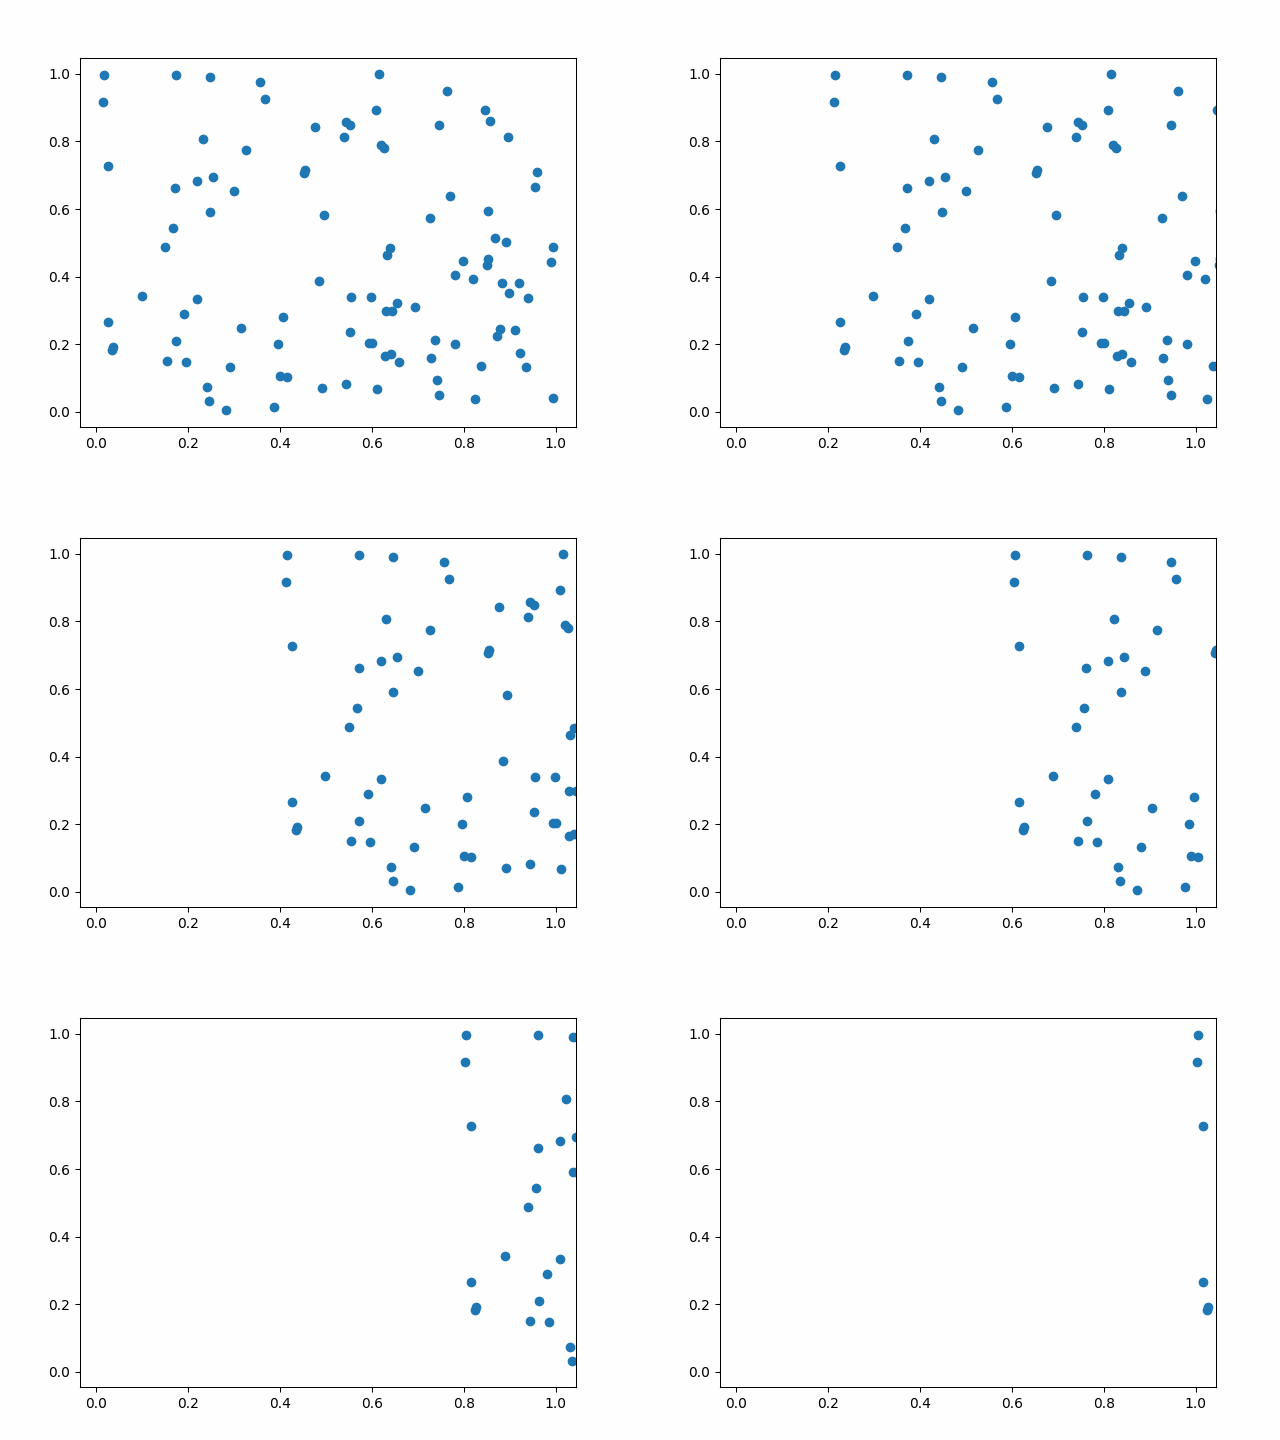
示例2:绘制散点图动画
import matplotlib.pyplot as plt
import matplotlib.animation as animation
import numpy as np
fig, ax = plt.subplots()
x = np.random.rand(100)
y = np.random.rand(100)
scatter = ax.scatter(x, y)
def update(frame):
scatter.set_offsets(np.column_stack((x+frame/100, y)))
return scatter,
ani = animation.FuncAnimation(fig, update, frames=100, interval=50)
ani.save('animation.gif', writer='pillow')
plt.show()2 matplotlib 绘制3D动画(animation)
Matplotlib允许您创建3D动画,通过使用FuncAnimation类,您可以在3D场景中制作动画。
示例:Matplotlib 绘制旋转的魔方动画
import numpy as np
import matplotlib.pyplot as plt
from mpl_toolkits.mplot3d import Axes3D
from matplotlib.animation import FuncAnimation
from mpl_toolkits.mplot3d.art3d import Poly3DCollection

# 创建一个3D图形对象
fig = plt.figure()
ax = fig.add_subplot(111, projection='3d')

# 定义立方体的顶点坐标和连接顺序
vertices = np.array([[1, 1, 1], [1, 1, -1], [1, -1, -1], [1, -1, 1],
                     [-1, 1, 1], [-1, 1, -1], [-1, -1, -1], [-1, -1, 1]])

faces = [[vertices[0], vertices[1], vertices[2], vertices[3]],
         [vertices[4], vertices[5], vertices[6], vertices[7]],
         [vertices[0], vertices[1], vertices[5], vertices[4]],
         [vertices[2], vertices[3], vertices[7], vertices[6]],
         [vertices[0], vertices[3], vertices[7], vertices[4]],
         [vertices[1], vertices[2], vertices[6], vertices[5]]]

# 定义每个面的颜色
colors = ['r', 'g', 'b', 'y', 'm', 'c']


# 初始化函数,创建空白图形
def init():
    return ax


# 动画更新函数,用于旋转立方体
def update(frame):
    ax.cla()  # 清除当前图形
    ax.set_xlim(-2, 2)
    ax.set_ylim(-2, 2)
    ax.set_zlim(-2, 2)
    ax.set_title(f'Frame {frame}')

    # 旋转立方体
    angle = frame * (360 / frames)
    for i, face in enumerate(faces):
        rotated_face = []
        for vertex in face:
            x, y, z = vertex
            x_rotated = x * np.cos(np.radians(angle)) - z * np.sin(np.radians(angle))
            z_rotated = x * np.sin(np.radians(angle)) + z * np.cos(np.radians(angle))
            rotated_face.append([x_rotated, y, z_rotated])
        rotated_face = np.array(rotated_face)
        ax.add_collection3d(Poly3DCollection([rotated_face], facecolors=colors[i], alpha=0.8))

    return ax


frames = 100  # 动画帧数
ani = FuncAnimation(fig, update, frames=frames, init_func=init, blit=False)

# 在创建FuncAnimation对象之后,添加以下代码保存动画为GIF文件
ani.save('rotating_colored_cube_animation.gif', writer='pillow', fps=30)

# 显示动画
plt.show()
上述代码演示了如何使用Matplotlib创建一个旋转的彩色3D立方体动画,并将其保存为GIF文件。以下是代码的主要部分和功能分析:
首先,导入必要的Python库:
numpy:用于处理数学运算和数组操作。matplotlib.pyplot:Matplotlib的绘图模块,用于创建和显示图形。mpl_toolkits.mplot3d.Axes3D:Matplotlib的3D绘图工具。matplotlib.animation.FuncAnimation:用于创建动画的Matplotlib类。创建一个3D图形对象(
fig)和一个3D坐标轴对象(ax)。定义立方体的顶点坐标(
vertices)和连接顺序(faces)。vertices包含了立方体的八个角点的坐标,而faces包含了连接这些点的面。定义每个面的颜色(
colors),这里使用了六种不同的颜色。编写初始化函数
init,它返回一个空白的3D图形。编写动画更新函数
update,它在每一帧中清除当前图形,然后重新绘制旋转后的立方体。动画中的旋转通过逐渐改变角度(angle)来实现。每个面的顶点坐标都根据旋转角度计算出旋转后的坐标,然后使用Poly3DCollection来绘制立方体的面,每个面使用不同的颜色。定义动画帧数(
frames),表示动画的总帧数。使用
FuncAnimation类创建动画对象(ani),传递初始化函数、更新函数、帧数等参数。使用
ani.save方法将动画保存为GIF文件,指定文件名('rotating_colored_cube_animation.gif')、GIF编写器('pillow',使用Pillow库)和帧速率(fps=30)。最后,通过
plt.show()显示动画。
这段代码实现了一个具有旋转动画效果的3D立方体,每个面都有不同的颜色,生成的动画保存为GIF文件。您可以根据需要修改颜色、帧数、文件名等参数来自定义动画。
3 总结:绘制动画的通用流程
(1)导入必要的库:首先,你需要导入Matplotlib库及其子模块,例如pyplot和animation。通常使用以下语句导入这些库:
import matplotlib.pyplot as plt
from matplotlib.animation import FuncAnimation
(2) 创建画布和子图:使用Matplotlib创建一个画布并添加子图(axes)。可以使用`plt.subplots()`函数来完成这个步骤:
fig, ax = plt.subplots()(3)定义初始化函数:创建一个函数来初始化动画。这个函数会设置图形的初始状态,例如绘制图形的背景、坐标轴的范围等,确保动画的每一帧都从相同的初始状态开始。
def init():
    # 设置图形的初始状态
    return ax
(4) 定义更新函数:创建一个函数来更新动画的每一帧。通常,这个函数根据时间或数据的变化更新图形。例如,你可以使用以下语句在每一帧中更新线条的位置:
```python
def update(frame):
    # 更新图形的每一帧
    # 更新线条的位置或其他图形元素
    return ax
```
(5)创建动画对象:使用`FuncAnimation`类创建一个动画对象。这个类接受以下参数:绘制图形的画布、更新函数、帧数、帧之间的延迟以及初始化函数。可以使用以下语句创建动画对象:
anim = FuncAnimation(fig, update, frames=num_frames, init_func=init, interval=interval, blit=True)其中,`fig`是创建的画布对象,通常为第2步中创建的对象;`update`是在第4步中定义的更新函数;`num_frames`是动画的总帧数;`init`是在第3步中定义的初始化函数;`interval`是帧之间的延迟(以毫秒为单位);`blit`是一个布尔值,表示是否只绘制变化的部分(默认值为False)。
(6)显示动画:使用`plt.show()`函数来显示动画。
