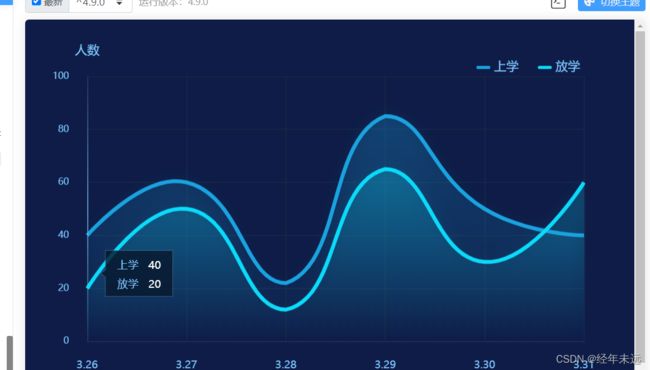
echarts 自动轮播双折线
let xLabel = [‘3.26’, ‘3.27’, ‘3.28’, ‘3.29’, ‘3.30’, ‘3.31’]
let goToSchool = [“40”, “60”, “22”, “85”, “50”, “40”]
let goOutSchool = [“20”, “50”, “12”, “65”, “30”, “60”]
option = {
backgroundColor: ‘#0e1c47’,
tooltip: {
trigger: ‘axis’,
backgroundColor:‘transparent’,
axisPointer: {
lineStyle: {
color: {
type: ‘linear’,
x: 0,
y: 0,
x2: 0,
y2: 1,
colorStops: [{
offset: 0,
color: ‘rgba(126,199,255,0)’ // 0% 处的颜色
}, {
offset: 0.5,
color: ‘rgba(126,199,255,1)’ // 100% 处的颜色
}, {
offset: 1,
color: ‘rgba(126,199,255,0)’ // 100% 处的颜色
}],
global: false // 缺省为 false
}
},
},
formatter: § => {
let dom = `
};
let len = 0
setInterval(()=>{
if(len === xLabel.length){
len = 0
}
myChart.dispatchAction({
type: ‘showTip’,
seriesIndex: 0,
dataIndex: len,
})
len ++
}, 1000)
