QT-QCustomplot实现左键拖动、右键框选、滚轮缩放与菜单选项

本文主要为了实现QCustomPlot的鼠标键盘事件

首先你需要已经下载到QcustomPlot所需的文件,这里不多做介绍,网上很多。
qchart也有一个版本。需要请转到https://blog.csdn.net/amxld/article/details/112987703

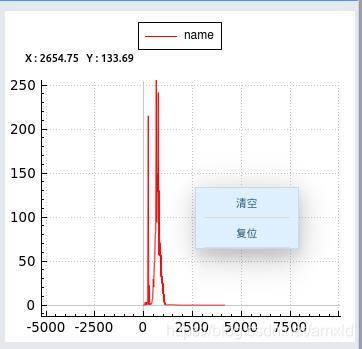
主要任务

1:鼠标左键拖动
2:鼠标右键框选能够显示框选的部分
3:滚轮能够放大缩小图像
4:鼠标单击右键可以显示菜单 功能:清空,复位
5:图像上发显示当前坐标并且保留两位小数
6:在图像正上方加入曲线的标签(默认是在图像右上角,操作比较麻烦需要自己调节位置)

下面是效果图

QT-QCustomplot实现左键拖动、右键框选、滚轮缩放与菜单选项_第1张图片

下面直接进入代码吧!
头文件函数定义:

class MyCustomplot : public QCustomPlot
{
    Q_OBJECT
    public:
    explicit MyCustomplot(QWidget *parent = 0);
    ~MyCustomplot();
    void setZoomMode(bool mode);
    public slots:
    void setPlotData(const QVector<float> plots,QString lineName);
protected:
    void mousePressEvent(QMouseEvent * event);
    void mouseMoveEvent(QMouseEvent * event);
    void mouseReleaseEvent(QMouseEvent * event);
    protected slots:
    void OnResetAction();
    void OnClearAction();
private:
    int m_graphIndex;
    bool mZoomMode;
    bool m_isMove;
    QRubberBand * mRubberBand;
      double m_minX,m_maxX,m_minY,m_maxY;
      QCPRange m_Xaxis,m_Yaxis;
    QPoint mOrigin;
   QLabel *m_lbxy;
   };

具体实现:

#include "mycustomplot.h"
#include "ui_mycustomplot.h"
#include 
#include 
MyCustomplot::MyCustomplot(QWidget *parent) :
    QCustomPlot(parent),
    mZoomMode(true),
    mRubberBand(new QRubberBand(QRubberBand::Rectangle, this))
{
    mRubberBand->setBackgroundRole(QPalette::Light);
    mRubberBand->setAutoFillBackground(true);
    
    setInteractions(QCP::iRangeDrag |QCP::iRangeZoom);
    plotLayout()->insertRow(0);
    // plotLayout()->insertRow(1);
    //   plotLayout()->insertColumn(0);
    m_lbxy  = new QLabel(this);
    QString LabelText = "X : "+QString::number(0,'f',2)+
            "   Y : "+QString::number(0,'f',2);
    m_lbxy->setText(LabelText);
    m_lbxy->setGeometry(20,40,250,15);   //标签显示
     //   QCPTextElement *title = new QCPTextElement(this, "", QFont("sans", 12, QFont::Bold));
    //    plotLayout()->addElement(0, 0, title);
    setInteraction(QCP::iRangeDrag,true);//使能拖动
    xAxis->setRange(0,4096);
    yAxis->setRange(0,100);
    m_Xaxis =  xAxis->range();
    m_graphIndex = 0;
    m_Yaxis =  yAxis->range();
    QCPAxisRect * axrect =new QCPAxisRect(this,false);
    axrect->setAutoMargins(QCP::msNone);
    axrect->insetLayout()->addElement(legend,Qt::AlignCenter);  //设置标签显示格式
    }
    MyCustomplot::~MyCustomplot()
    {
    }
void MyCustomplot::setZoomMode(bool mode) 
  {
    mZoomMode = mode;
  }
void MyCustomplot::setPlotData(const QVector<float> plots, QString lineName)
{
    addGraph(); // blue line  //加线
    
    graph(m_graphIndex)->setPen(QPen(Qt::red));
    //customPlot->graph(0)->setBrush(QBrush(QColor(240, 255, 200)));
    graph(m_graphIndex)->setAntialiasedFill(false);
    graph(m_graphIndex)->setName(lineName);
    int count = 0;
    for(auto it = plots.begin();it!=plots.end();it++)
    {
        graph(m_graphIndex)->addData(count, *it);
        count++;
    }
    m_graphIndex++;
    replot();
}
void MyCustomplot::mousePressEvent(QMouseEvent * event)
{
    if (mZoomMode) //判断是否可以触发
    {
        if (event->button() == Qt::RightButton)
        {
            mOrigin = event->pos();
            mRubberBand->setGeometry(QRect(mOrigin, QSize()));
            mRubberBand->show();
        }
    }
  QCustomPlot::mousePressEvent(event);
}

void MyCustomplot::mouseMoveEvent(QMouseEvent * event)
{
    int x_pos = event->pos().x();
    int y_pos = event->pos().y();
    
    //鼠标坐标转化为CustomPlot内部坐标
    float x_val = xAxis->pixelToCoord(x_pos);
    float y_val = yAxis->pixelToCoord(y_pos);
    QString LabelText = "X : "+QString::number(x_val,'f',2)+
            "   Y : "+QString::number(y_val,'f',2);
    m_lbxy->setText(LabelText);
     if (mRubberBand->isVisible())
    {
        mRubberBand->setGeometry(QRect(mOrigin, event->pos()).normalized());
    }
    QCustomPlot::mouseMoveEvent(event);\
}

void MyCustomplot::mouseReleaseEvent(QMouseEvent * event)
{
    if (mRubberBand->isVisible())
    {
        const QRect zoomRect = mRubberBand->geometry();
        int xp1, yp1, xp2, yp2;
        if(zoomRect.width()>5&&zoomRect.height()>5)
        {
        //获取坐标
            zoomRect.getCoords(&xp1, &yp1, &xp2, &yp2);
            double x1 = xAxis->pixelToCoord(xp1);
            double x2 = xAxis->pixelToCoord(xp2);
            double y1 = yAxis->pixelToCoord(yp1);
            double y2 = yAxis->pixelToCoord(yp2);
            xAxis->setRange(x1, x2);
            yAxis->setRange(y1, y2);
            mRubberBand->hide();
            replot();
             }
        else
        {
            QMenu *pMenu = new QMenu(this);
            
            QAction *act_Clear = new QAction(tr("清空"), this);
            QAction *act_Reset = new QAction(tr("复位"), this);
            //把QAction对象添加到菜单上
            pMenu->addAction(act_Clear);
            pMenu->addAction(act_Reset);
                    //连接鼠标右键点击信号
            connect(act_Clear, SIGNAL(triggered()), this, SLOT(OnClearAction()));
            connect(act_Reset, SIGNAL(triggered()), this, SLOT(OnResetAction()));
            
            //在鼠标右键点击的地方显示菜单
            pMenu->exec(cursor().pos());
            
            //释放内存
            QList<QAction*> list = pMenu->actions();
            foreach (QAction* pAction, list) delete pAction;
            delete pMenu;
             }
    }
    mRubberBand->hide();
    QCustomPlot::mouseReleaseEvent(event);
}
//复位
void MyCustomplot::OnResetAction()
{
    
    xAxis->setRange(m_Xaxis.lower,m_Xaxis.upper);
    //    xAxis->scaleRange(1.0,1.0);
    //    yAxis->scaleRange(1.0,1.0);
    yAxis->setRange(m_Yaxis.lower,m_Yaxis.upper);
    replot();
}
//清空
void MyCustomplot::OnClearAction()
{
    m_graphIndex = 0;
    this->clearGraphs();
    replot();
}

代码就这些,可以试下有问题可以评论联系我。
QT4/5都可以使用,虽然没有Qchart方便好看,但是在QT4完美运行。
qchart也有一个版本。需要请转到https://blog.csdn.net/amxld/article/details/112987703
你可能感兴趣的:(c++,QT,qt)