Qt - QCustomPlot折线图
文章目录
- 简介
- 下载
- 基本概念
- 使用方式
-
- 添加源码
- 打包动态库调用
-
- sharedlib-compilation
- sharedlib-usage
- 小结
- 简单使用
-
- 坐标轴
- 曲线
- 图例
- 简单封装
-
- 创建曲线
- 获取曲线
- 添加数据点
- 动态图表
- 交互
-
- 点击图例
- 点击曲线
- 性能改善
- 关于OpenGL加速
- freeglut
- OpenGL使用
- OpenGL碎碎念
- 参考鸣谢
简介
QCustomPlot 是一个Qt三方图表库,在 QChart 还未免费开放时,应该是一个很受欢迎的三方库。即使现在 QChart 已经可以免费使用了,有些功能使用 QCustomPlot 实现,体验也非常棒!下图为 QCustomPlot官网 的一些示例,非常丰富。
下载
QCustomPlot官网
这里我下载的是最新的版本 QCustomPlot 2.0.1
下载的文件包括:
- 非常详细的说明文档
- 官方实例
- 源码及一份GPL声明
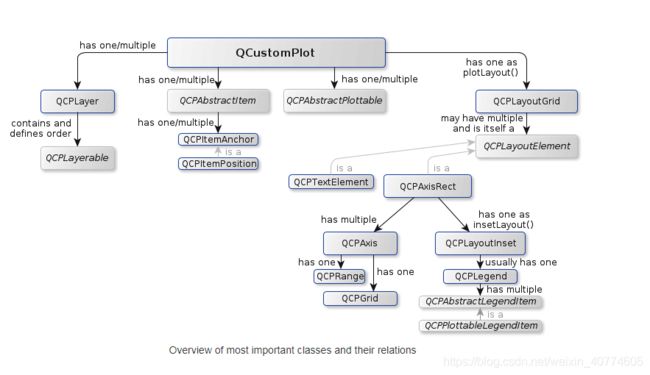
基本概念
-
QCustomPlot- 图表类:用于图表的显示和交互
-
QCPLayer- 图层:管理图层元素(QCPLayerable),所有可显示的对象都是继承自图层元素
-
QCPAbstractPlottable-
绘图元素,包含以下几种:
QCPGraph(折线图)QCPCurve(曲线图)QCPBars(柱状图)QCPStatiBox(盒子图)QCPColorMap(色谱图)QCPFinancial(金融图)
-
-
QCPAxisRect- 坐标轴矩形:一个坐标轴矩形默认包含上下左右四个坐标轴,但是可以添加多个坐标轴
使用方式
添加源码
QCustomPlot2.1 - QCustomPlot.tar.gz
取其 qcustomplot.cpp 和 qcustomplot.h;将其加入工程。可以直接创建,亦可将 QWidget 提升为 QCustomPlot。
该方法最方便,也非常时候调试以及魔改。
打包动态库调用
QCustomPlot2.1 - QCustomPlot-sharedlib.tar.gz
该压缩包包含两部分
sharedlib-compilation(构建库的工程配置)sharedlib-usage(使用库的工程配置)
在QT中编译非常简单,qmake & make 即可,此处略。
sharedlib-compilation
#
#  Project to compile QCustomPlot as shared library (.so/.dll) from the amalgamated sources
#

QT += core gui
greaterThan(QT_MAJOR_VERSION, 4): QT += widgets printsupport

greaterThan(QT_MAJOR_VERSION, 4): CONFIG += c++11
lessThan(QT_MAJOR_VERSION, 5): QMAKE_CXXFLAGS += -std=c++11

// [1] 编译为共享库(.so / .dll)时所需定义标志
DEFINES += QCUSTOMPLOT_COMPILE_LIBRARY
TEMPLATE = lib
CONFIG += debug_and_release build_all
// [2] 默认共享库
static {
  CONFIG += static
} else {
  CONFIG += shared
}
// [3] 添加源码
SOURCES += qcustomplot.cpp
HEADERS += qcustomplot.h

VERSION = 2.1.0

TARGET = qcustomplot
CONFIG(debug, debug|release) {
  TARGET = $$join(TARGET,,,d) # if compiling in debug mode, append a "d" to the library name
  QMAKE_TARGET_PRODUCT = "QCustomPlot (debug mode)"
  QMAKE_TARGET_DESCRIPTION = "Plotting library for Qt (debug mode)"
} else {
  QMAKE_TARGET_PRODUCT = "QCustomPlot"
  QMAKE_TARGET_DESCRIPTION = "Plotting library for Qt"
}
QMAKE_TARGET_COMPANY = "www.qcustomplot.com"
QMAKE_TARGET_COPYRIGHT = "Copyright (C) by Emanuel Eichhammer"
sharedlib-usage
#
# Example project that uses QCustomPlot as a shared library
#
# The compiled shared library file(s) must be in the project directory.
# On Unix, set LD_LIBRARY_PATH to "." before launching the compiled application
# unless the library files are installed in one of the library locations (e.g. /usr/lib)
#
# Note that the qcustomplot.h header should not be added to the project file in the
# HEADERS variable, but only included in your source files with #include.
#

QT       += core gui
greaterThan(QT_MAJOR_VERSION, 4): QT += widgets printsupport

greaterThan(QT_MAJOR_VERSION, 4): CONFIG += c++11
lessThan(QT_MAJOR_VERSION, 5): QMAKE_CXXFLAGS += -std=c++11

TARGET = sharedlib-usage
TEMPLATE = app

# Tell the qcustomplot header that it will be used as library:
// [1] 使用所需定义标志
DEFINES += QCUSTOMPLOT_USE_LIBRARY

# Link with debug version of qcustomplot if compiling in debug mode, else with release library:
CONFIG(debug, release|debug) {
  win32:QCPLIB = qcustomplotd2
  else: QCPLIB = qcustomplotd
} else {
  win32:QCPLIB = qcustomplot2
  else: QCPLIB = qcustomplot
}
LIBS += -L./ -l$$QCPLIB

SOURCES += main.cpp
小结
若只在单处调用,且可能对 QCustomPlot 进行一些修改,可直接添加源码使用。若存在多处调用建议封装为动态库,这样在打包APP时这也会节省些空间。
简单使用
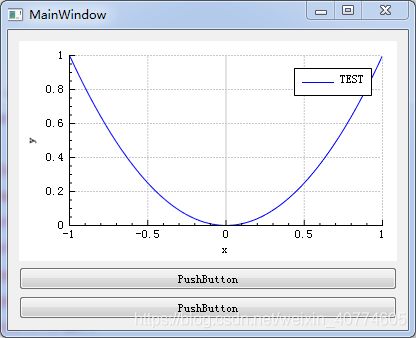
    QVector<double> x(101), y(101);
    for (int i = 0; i < 101; ++i) {
        x[i] = i / 50.0 - 1; // -1 到 1
        y[i] = x[i] * x[i];
    }

    QCustomPlot* customPlot = ui->customPlot;
    customPlot->setOpenGl(true);
    customPlot->addGraph();
    customPlot->graph(0)->setData(x, y);
    customPlot->graph(0)->setName("TEST");
    customPlot->xAxis->setLabel("x");
    customPlot->yAxis->setLabel("y");
    customPlot->xAxis->setRange(-1, 1);
    customPlot->yAxis->setRange(0, 1);
    customPlot->legend->setVisible(true);

    customPlot->replot();
坐标轴
// 自动扩展
customPlot->rescaleAxes();
customPlot->replot(QCustomPlot::rpQueuedReplot);

// 可滚动可缩放
customPlot->setInteractions(QCP::iRangeDrag | QCP::iRangeZoom);

/*! QCPAxis有相应的函数可以设置坐标轴的刻度、间距、范围等 */
//设置刻度间距
setTickStep(double step);
//将坐标轴刻度设置为vec
setTickVector(const QVector<double> &vec);
//设置是否自动分配刻度间距
setAutoTickStep(bool on);
//设置是否自动分配刻度
setAutoTicks(bool on);
//设置是否自动分配刻度数量
setAutoTickCount(int approximateCount);
曲线
// 设置曲线画笔
customPlot->graph(0)->setLineStyle((QCPGraph::lsStepLeft));

// 设置曲线上点的风格(样式)
customPlot->graph(0)->setScatterStyle(QCPScatterStyle(QCPScatterStyle::ssCircle, 5));

// 设置曲线风格
QPen graphPen;
graphPen.setColor(qcolor);
graphPen.setWidthF(2);
customPlot->graph(0)->setPen(graphPen);

//设置曲线形状
QCPGraph::setBrush(const QBrush &brush);
//设置与某之间曲线填充
QCPGraph::setChannelFillGraph(otherGraph);
//移除填充
QCPGraph::setBrush(Qt::NoBrush);
图例
// 图例默认是关闭的,需要我们开启
customPlot->legend->setVisible(true);

// 设置图例行优先排列
customPlot->legend->setFillOrder(QCPLayoutGrid::foColumnsFirst);
// 设置六个图例自动换行
customPlot->legend->setWrap(6);

// 设置图例位置
customPlot->axisRect()->insetLayout()->setInsetAlignment(0, Qt::AlignHCenter|Qt::AlignTop);
// 设置边框隐藏
customPlot->legend->setBorderPen(Qt::NoPen);
简单封装
创建曲线
QCPGraph* newLine(QCustomPlot *customPlot,QString lineName,QColor color,bool isPointLine = false){
    QCPGraph *mGraph = customPlot->addGraph();
    mGraph->setName(lineName);
    if(isPointLine){
        mGraph->setPen(QPen());
    }
    QPen graphPen;
    graphPen.setColor(color);
    graphPen.setWidthF(rand()/(double)RAND_MAX*2+1);
    mGraph->setPen(graphPen);
    return mGraph;
}
获取曲线
void getLine(QCustomPlot *customPlot,QString lieName,QCPGraph* & graph, QColor color,bool isPointLine = false){
    graph = nullptr;
    for(int i = 0; i < customPlot->graphCount(); i++){
        QCPGraph *currLine = customPlot->graph(i);
        if(lieName == currLine->name()){
            graph =  currLine;
        }
    }
    if(nullptr == graph){
        graph = newLine(customPlot,lieName,color,isPointLine);
    }
}
添加数据点
注意:这里我们仅保留当前y轴大小的点数据。避免持续追加数据时避免内存无限增长~
void addPoint(QCustomPlot *customPlot,QString lineName, double data, int maxCount ,bool pointDisplay){

    QCPGraph *mGraph = nullptr;
    getLine(customPlot,lineName,mGraph,QColor(rand()%245+10, rand()%245+10, rand()%245+10),pointDisplay);

    /*! Y Axis auto adjustment*/
//    if(data > customPlot->yAxis->range().upper){
//        double yMin = customPlot->yAxis->range().lower;
//        int tickCount = customPlot->yAxis->ticker().data()->tickCount();
//        int tickSize =  customPlot->yAxis->range().upper/tickCount;
//        double yMax = ((data/tickSize)+1)*tickSize;
//        customPlot->yAxis->setRange(yMin,yMax);

//        qDebug() << " tickCount= " << tickCount << " tickSize= " << tickSize <<  " yMax= " << yMax;
//    }

    int pointCount = mGraph->dataCount();
    QCPGraphDataContainer * mDataContainer = mGraph->data().data();
    QVector<QCPGraphData> mOldPoints;
    mDataContainer->getData(mOldPoints);
    QVector<double> newKeys;
    QVector<double> newValues;
    if(pointCount > maxCount){
        for(int i =1; i < pointCount; i++){
            double x = mOldPoints.at(i).key;
            double y = mOldPoints.at(i).value;
            newKeys.append(x-1);
            newValues.append(y);
        }
        double x = mOldPoints.at(pointCount-1).key;
        newKeys.append(x);
        newValues.append(data);
        mGraph->setData(newKeys,newValues);
        customPlot->rescaleAxes();
        customPlot->replot(QCustomPlot::rpQueuedReplot);
    }else{
        double x = mOldPoints.at(pointCount - 1).key;
        mGraph->addData(x + 1,data);
        customPlot->rescaleAxes();
        customPlot->replot(QCustomPlot::rpQueuedReplot);
    }
}
动态图表
    /*! Legend */
    ui->customPlot->legend->setVisible(true);

    QTimer *timer = new QTimer;
    ui->customPlot->xAxis->setRange(1,2);
    ui->customPlot->rescaleAxes();
    static double i = 0;
    connect(timer,&QTimer::timeout,[=]{
        if(ui->customPlot->xAxis->range().upper < maxCount){
            i++;
            ui->customPlot->xAxis->setRange(1,i);
        }
        addPoint(ui->customPlot,"V3",qrand()%20,maxCount,false);
        addPoint(ui->customPlot,"V1",qrand()%10,maxCount,false);
    });
    timer->start(200);
交互
点击图例
注意:这里实现的效果是点击控制曲线的显示及隐藏。
connect(ui->customPlot, SIGNAL(legendClick(QCPLegend*,QCPAbstractLegendItem*,QMouseEvent*)),this, SLOT(legendClick(QCPLegend*,QCPAbstractLegendItem*)));

void MainWindow::legendClick(QCPLegend *legend, QCPAbstractLegendItem *item)
{
  Q_UNUSED(legend)
  if (item)
  {
    QCPPlottableLegendItem *plItem = qobject_cast<QCPPlottableLegendItem*>(item);
    qDebug() << "plItem = " << plItem->plottable()->name();
    QCPGraph *mGraph = nullptr;
    getLine(ui->customPlot,plItem->plottable()->name(),mGraph,QColor());
    bool isVisible = mGraph->visible();
    mGraph->setVisible(!isVisible);
  }
}
点击曲线
注意:这里我通过点击获取曲线上点的x坐标。
void MainWindow::setLineClickable(QCustomPlot* customPlot,bool clickanble){
    disconnect(customPlot, SIGNAL(plottableClick(QCPAbstractPlottable*,int,QMouseEvent*)),
               this, SLOT(graphClicked(QCPAbstractPlottable*,int)));
    if(clickanble){
        connect(customPlot, SIGNAL(plottableClick(QCPAbstractPlottable*,int,QMouseEvent*)),
                this, SLOT(graphClicked(QCPAbstractPlottable*,int)));
    }
}

void MainWindow::graphClicked(QCPAbstractPlottable *plottable, int dataIndex){
    qDebug() << "dataIndex = " << dataIndex;
}
性能改善
关于性能改善,官方有专门的一篇文档 Plot Performance Improvement,但是我还没仔细研究~
QCustomPlot 采用了诸如自适应采样和文本对象缓存之类的各种技术,以减少重新绘制所需的时间。但是,某些功能(如复杂的半透明填充和粗线)仍会导致速度显着下降。如果您在应用程序中注意到这一点,这里有一些有关如何提高重复打印性能的提示。
为了得到更高的绘图性能,我们需尽量做到:
-
避免使用复杂的填充
-
避免笔宽度大于一的线
-
避免多次不必要的
replot -
要在范围拖动期间提高响应速度,可使用
QCustomPlot :: setNoAntialiasingOnDrag(true)。仅在使用默认软件渲染器时才有意义。仅在默认软件渲染时有效 -
避免使用任何类型的
alpha(透明)颜色,尤其是在填充中 -
避免任何形式的抗锯齿,尤其是在图形行中(请参见
QCustomPlot :: setNotAntialiasedElements)。仅在使用默认软件渲染器时才有意义 -
避免重复设置完整的数据集,例如使用
QCPGraph :: setData。如果大多数数据点保持不变,例如在运行的测量中,请改用QCPGraph :: addData。您可以通过QCPGraph :: data访问和操作现有数据 -
作为最后的选择,请尝试减少任何给定时刻在可见键范围内的数据点数量,例如通过限制最大键范围跨度(请参阅
QCPAxis :: rangeChanged信号)。QCustomPlot可以非常有效地优化掉数百万个屏幕外点
关于OpenGL加速
值得注意的是 QCustomPlot 虽然有开启 OpenGL 的接口,但是其也明确说明:
  \warning This is still an experimental feature and its performance depends on the system that it
  runs on. Having multiple QCustomPlot widgets in one application with enabled OpenGL rendering
  might cause context conflicts on some systems.
翻译过来就是,虽然有这个接口但是不一定能用,具体能不能用看系统。
开启 qcustomplot 的 opengl 需要安装 glut库 ,由于 GLUT 的作者已经很久没更新了,所以一般都用 freeglut。
freeglut 是glut的超集,支持glut所有的api,跨平台( MS-Win,Linux,Mac OS均支持)。
本文使用的是 Freeglut-3.2.1。
freeglut
下载地址
- 源码下载
- 官方编译版本
环境配置
由于我的编译器是 msvc2013 ,这里以该版本进行演示,下载 freeglut-MSVC-3.0.0-2.mp
注意 OpenGL32.lib 是必须的,请在系统中查找并将其添加进来:
工程配置
# Qcustomplot
INCLUDEPATH += $$PWD/../xxx/Qcustomplot
win32: LIBS += -L$$PWD/../xxx/Qcustomplot/x64/ -lqcustomplot2
win32: DEPENDPATH += $$PWD/../xxx/Qcustomplot/x64
unix:!macx: LIBS += -L$$PWD/../xxx/Qcustomplot/arm/ -lqcustomplot
                                                                -lqcustomplot
unix:!macx: DEPENDPATH += $$PWD/../xxx/Qcustomplot/arm

# OpenGL
win32: LIBS += -L$$PWD/../xxx/Qcustomplot/openGL/ -lOpenGL32 \
                                                                -lfreeglut
win32:INCLUDEPATH += $$PWD/../xxx/Qcustomplot/openGL
win32:DEPENDPATH += $$PWD/../xxx/Qcustomplot/openGL

#unix:!macx: LIBS += -lGL -lglut
初始化
#include 验证是否成功
#include OpenGL使用
freeglut 已经配置好了,我们还需要开启QT的 `opengl模块并调用setOpenGl()`` 接口。
// pro
QT += opengl
DEFINES += QCUSTOMPLOT_USE_OPENGL

// cpp
m_pCustomPlot->setOpenGl(true);
OpenGL碎碎念
开启 OPenGL 的接口上有这么一段描述:
warning This is still an experimental feature and its performance depends on the system that it
runs on. Having multiple QCustomPlot widgets in one application with enabled OpenGL rendering
might cause context conflicts on some systems.
也就是说,QCustomPlot 对 OpenGL 的支持有点不尽人意,至少明面上已经说明了开启 OpenGL 可能存在 上下文冲突 的风险!
我特意去翻了一下,这个警告从 2017_9 发布的 QCustomPlot2.0.0 开始就已经存在,截至最新版本 2021_3 刚发布的 QCustomPlot2.1.0,历时三年有余,它依然存在!
所以你的图表对性能要求比较高,必须要使用 OpenGL加速,那么我并不推荐使用 QCustomPlot,即使它很酷;还是得老老实实用 QChart 。
那么如果你很不幸的在项目中较大规模地使用到了 QCustomPlot 该怎么解决或绕过这个坑呢?
- 参考本文 性能改善
- 已知开启/关闭
OpenGL可影响绘制速度,即customPlot->replot是主要的瓶颈。在不考虑魔改replot( )的情况下,我只能选择将其放在单独的子线程中,避免阻塞主线程。
如果有别的方法可以解决以上问题,欢迎留言交流~
参考鸣谢
QCustomPlot使用手册
qcustomplot绘制实时波形图(频谱图、瀑布图、星座图)并开启opengl支持
QT的绘图库 QCustomPlot 用法介绍 以及 使用 OpenGL 开启渲染


