golang物联网
In this article, we’ll be setting up step by step, a monitoring environment for IoT devices with an Arduino based board (ESP32), Grafana, and Google Cloud Platform tools. We’ll be using other tools like Docker and Prometheus, you don’t need to know how to use them, but I highly recommend that you know what they are and what they do.
在本文中,我们将逐步设置一个使用基于Arduino的板( ESP32 ), Grafana和Google Cloud Platform工具对IoT设备进行监视的环境。 我们将使用其他工具,例如Docker 和Prometheus ,您不需要知道如何使用它们,但是我强烈建议您了解它们的用途。
First, let’s take a look into our infrastructure:
首先,让我们看一下我们的基础架构:
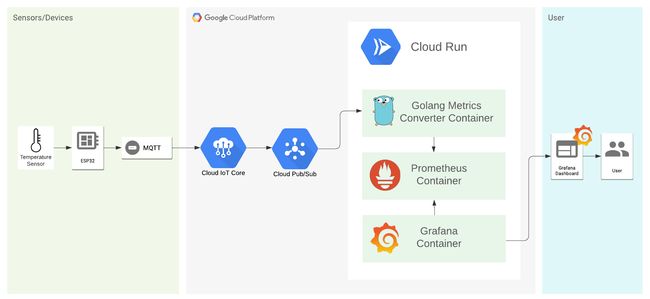
We’re using the built-in temperature sensor from ESP32 to sent data every 5 seconds to a pub/sub service in GCP. This data will be processed by a Go service and sent to Prometheus, and we’re using Grafana to visualize this data.
我们使用ESP32内置的温度传感器每5秒将数据发送到GCP中的发布/订阅服务。 这些数据将由Go服务处理并发送到Prometheus ,我们正在使用Grafana可视化此数据。
Grafana is a visualization tool. Prometheus is a data source for Grafana that collects the data in time series and displays in a way that Grafana understands. Since Prometheus can’t collect data directly to pub/sub, we need a third service to send it to Prometheus.
Grafana是一种可视化工具。 Prometheus是Grafana的数据源,它按时间序列收集数据并以Grafana理解的方式显示。 由于Prometheus无法直接将数据收集到pub / sub,因此我们需要第三项服务将其发送给Prometheus。
I made a Github repository with all the codes used and instructions in this article, fell free to check it out.
我创建了一个Github存储库,其中包含本文中使用的所有代码和说明,可以随意查看。
So let’s get our hands dirty!
因此,让我们动手吧!
Google Cloud Platform入门 (Getting started with Google Cloud Platform)
On Google Cloud, we’ll be using Core IoT to manage our devices, pub/sub as messaging system and Google Run to host our containers.
在Google Cloud上,我们将使用Core IoT管理设备,将发布/订阅作为消息传递系统,并在Google Run中托管容器。
First, let’s set up our project. You’ll need a Google account and a credit card, but don’t worry you won’t be charged for anything (if you don’t do some heavy work), your free trial lasts for 3 months and you have US$300 to spend in any Google Cloud service. But you can always keep an eye on your billing board to not have any surprises on your credit card.
首先,让我们建立项目。 您需要一个Google帐户和一张信用卡,但是不用担心,您无需支付任何费用(如果您不做繁重的工作),免费试用期为3个月,您有300美元在任何Google Cloud服务中花费。 但是,您始终可以随时注意帐单上的内容,以确保信用卡不会出现任何意外。
I’ll use the Google Cloud CLI to set up our environment but feel free to use the web console. Install it for your operational system.
我将使用Google Cloud CLI设置环境,但可以随时使用Web控制台。 为您的操作系统安装它。
To make things easier, you can export this environment variables and just paste the commands from this tutorial (choose your own names):
为了简化操作,您可以导出此环境变量,然后仅粘贴本教程中的命令(选择您自己的名称):
export PROJECT_ID=export REGION=export TOPIC_ID=export SUBSCRIPTION=export REGISTRY=export DEVICE_ID=export USER_NAME=export IMAGE_NAME=export SERVICE_NAME=The export command should look like this:
导出命令应如下所示:
export PROJECT_ID=temperature-grafana
export PROJECT_ID=temperature-grafana
To start, log in with your Google account on CLI, create a project, and select the project created. Open a terminal and type the following commands:
首先,在CLI上使用您的Google帐户登录,创建一个项目,然后选择创建的项目。 打开终端并输入以下命令:
$ gcloud auth login
$ gcloud projects create $PROJECT_ID
$ gcloud config set project $PROJECT_ID
You can check your project dashboard, and if everything goes well, you should see your project there.
您可以检查项目仪表板,如果一切顺利,则应该在此处看到您的项目。