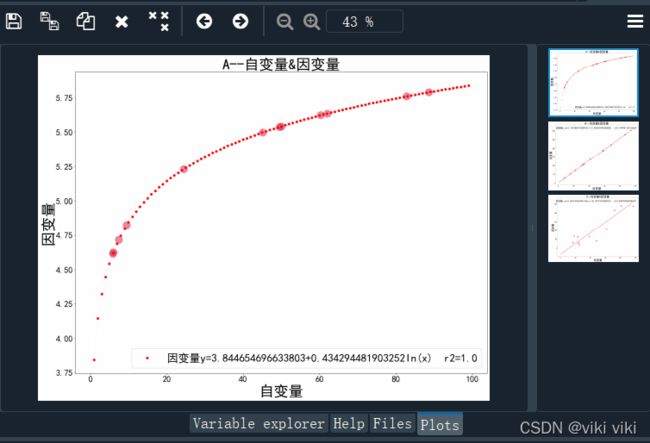
封装好的散点图拟合八大函数回归模型(逆、幂函、对数、S、复合、生长、指数 、线性函数,)
一.知识
给定一些散点,拟合函数去分析其自变量和因变量变动关系,这时候可以选择多种函数去进行拟合
例如excel里面会有添加趋势线这种工具,里面可以选择不同的工具,spss里面有不同函数可以同时选择进行拟合。
但是以上两种方法对单组数据操作比较方便,如果有多组数据就要不停重复导入数据进行操作,查看趋势线,该工作过于繁杂,所以创建了该代码。该函数我已经封装好代码欢迎直接调用我的代码。
二、代码调用过程
我已经虚拟一套数据集作为列子
| 日期 | 标签 | 自变量 | 因变量 |
| 2021年1月1日 | A | 49.63594 | 5.540451 |
| 2021年1月2日 | A | 24.5104 | 5.234005 |
| 2021年1月3日 | A | 49.93535 | 5.543063 |
| 2021年1月4日 | A | 62.09605 | 5.637719 |
| 2021年1月5日 | A | 82.77789 | 5.762569 |
| 2021年1月6日 | A | 88.63828 | 5.792276 |
| 2021年1月7日 | A | 6.045908 | 4.626116 |
| 2021年1月8日 | A | 7.498912 | 4.719653 |
| 2021年1月9日 | A | 9.502011 | 4.82247 |
| 2021年1月10日 | A | 60.30125 | 5.624981 |
| 2021年1月11日 | A | 45.19309 | 5.499727 |
| 2021年1月12日 | A | 5.901614 | 4.615626 |
| 2021年1月13日 | B | 41.6386 | 135.8847 |
| 2021年1月14日 | B | 58.23258 | 188.4683 |
| 2021年1月15日 | B | 15.78591 | 52.23334 |
| 2021年1月16日 | B | 32.88107 | 108.2983 |
| 2021年1月17日 | B | 68.40336 | 219.6259 |
| 2021年1月18日 | B | 22.22 | 72.62345 |
| 2021年1月19日 | B | 8.048647 | 29.02982 |
| 2021年1月20日 | B | 33.13403 | 106.557 |
| 2021年1月21日 | B | 86.59669 | 277.6387 |
| 2021年1月22日 | B | 94.47097 | 304.685 |
| 2021年1月23日 | B | 57.93375 | 186.9587 |
| 2021年1月24日 | B | 30.49006 | 99.87595 |
| 2021年1月25日 | C | 25.24164 | 18.41345 |
| 2021年1月26日 | C | 38.64638 | 63.9966 |
| 2021年1月27日 | C | 18.45192 | 65.63098 |
| 2021年1月28日 | C | 84.22761 | 268.1763 |
| 2021年1月29日 | C | 23.32117 | 61.23712 |
| 2021年1月30日 | C | 97.17947 | 237.9303 |
| 2021年1月31日 | C | 48.25496 | 40.07267 |
| 2021年2月1日 | C | 16.88487 | 29.8532 |
| 2021年2月2日 | C | 24.10362 | 28.57303 |
| 2021年2月3日 | C | 61.63955 | 107.2201 |
| 2021年2月4日 | C | 72.30827 | 215.4583 |
| 2021年2月5日 | C | 81.15836 | 239.947 |
这里开始讲解我的参数
data_df:导入的dataframe列名如下,['日期',‘标签’,‘自变量’,‘因变量’],日期这一列名称可以进行自定义,可以不按照我的,设置自己喜欢的index方式,其他三列请按照我的名称。ps:标签是记录哪一组数据回归的意思。测试的数据集,我会放入我的资源里面,欢迎大家下载测试代码。
x_自变量: x_自变量='自变量' ,这里输入自变量的名称。
y_因变量: y_因变量='因变量' ,这里输入你变量的名称。
fw:np.arange(1,100,1) ,这里numpy生产一系列数据,这里控制的是x轴的范围,怎么画图。
io_1:r'C:\Users\***\Desktop\临时文件',这个写入生成的回归图片保存的路径
def analysis_of_regression(data_df,x_自变量,y_因变量,fw,io_1):
    import matplotlib.pyplot as plt

    import pandas as pd
    from sklearn.metrics import r2_score
    plt.rcParams['font.sans-serif']=['SimHei'] #用来正常显示中文标签
    plt.rcParams['axes.unicode_minus']=False #用来正常显示负号

    #%%需要外部加载的变量


    # df_a = pd.DataFrame( columns=['标签','类型', 'r2', '航司','公式'])
    df_a = pd.DataFrame()
    df_d = pd.DataFrame(columns=('标签','类型','r2','系数'))


    data_array = np.array(data_df[['标签']])
    b=data_array.tolist()
    a=[x for tup in b for x in tup]

    a = list(set(a))


    #开始进行函数拟合
    for i in a:
    # for i in [1]:
        jj=data_df[(data_df['标签']==i)]
        # jj=data_df
        ##线性
        x_cz_2=jj[['自变量']].values.tolist()
        y_cz_2=jj[['因变量']].values.tolist()
        x_cz_2=sum(x_cz_2,[])
        y_cz_2=sum(y_cz_2,[])
        L=np.polyfit(x_cz_2, y_cz_2, 1)
        print(L)
        Z=np.polyval(L,x_cz_2,)
        score = r2_score(y_cz_2, Z, multioutput='raw_values')
        print('线性:'+str(score))
        new=pd.DataFrame({'标签':i,
                          '类型':'线性',
                          'r2':score,
                          '系数':[L]})

        df_d=df_d.append(new,ignore_index=(True))


        ##指数
        x_cz_2=jj[['自变量']].values.tolist()
        y_cz_2=jj[['因变量']].values.tolist()
        x_cz_2=sum(x_cz_2,[])
        y_cz_2=sum(y_cz_2,[])
        L=np.polyfit(x_cz_2, np.log(y_cz_2), 1)
        Z=np.polyval(L,x_cz_2)
        true=np.exp(Z)
        score = r2_score(y_cz_2,true, multioutput='raw_values')
        print('指数:'+str(score))
        new=pd.DataFrame({'标签':i,
                          '类型':'指数',
                          'r2':score,
                          '系数':[L]})

        df_d=df_d.append(new,ignore_index=(True))


        # ##二次
        # x_cz_2=jj[['自变量']].values.tolist()
        # y_cz_2=jj[['因变量']].values.tolist()
        # x_cz_2=sum(x_cz_2,[])
        # y_cz_2=sum(y_cz_2,[])
        # L=np.polyfit(x_cz_2, y_cz_2, 2)
        # print(L)
        # Z=np.polyval(L,x_cz_2,)
        # score = r2_score(y_cz_2, Z, multioutput='raw_values')
        # print('二次:'+str(score))

        # new=pd.DataFrame({'标签':i,
        #                   '类型':'二次',
        #                   'r2':score,
        #                   '系数':[L]})

        # df_d=df_d.append(new,ignore_index=(True))


        ##幂函数
        x_cz_2=jj[['自变量']].values.tolist()
        y_cz_2=jj[['因变量']].values.tolist()
        x_cz_2=sum(x_cz_2,[])
        y_cz_2=sum(y_cz_2,[])
        L=np.polyfit(np.log(x_cz_2), np.log(y_cz_2), 1)
        Z=np.polyval(L,np.log(x_cz_2))
        true=np.exp(Z)
        score = r2_score(y_cz_2,true, multioutput='raw_values')
        print('幂函数:'+str(score))

        new=pd.DataFrame({'标签':i,
                          '类型':'幂函数',
                          'r2':score,
                          '系数':[L]})

        df_d=df_d.append(new,ignore_index=(True))

        ##对数
        x_cz_2=jj[['自变量']].values.tolist()
        y_cz_2=jj[['因变量']].values.tolist()
        x_cz_2=sum(x_cz_2,[])
        y_cz_2=sum(y_cz_2,[])
        L=np.polyfit(np.log(x_cz_2), y_cz_2, 1)
        Z=np.polyval(L,np.log(x_cz_2))
        score = r2_score(y_cz_2,Z, multioutput='raw_values')
        print('对数:'+str(score))

        new=pd.DataFrame({'标签':i,
                          '类型':'对数',
                          'r2':score,
                          '系数':[L]})

        df_d=df_d.append(new,ignore_index=(True))


        ##复合函数
        x_cz_2=jj[['自变量']].values.tolist()
        y_cz_2=jj[['因变量']].values.tolist()
        x_cz_2=sum(x_cz_2,[])
        y_cz_2=sum(y_cz_2,[])
        L=np.polyfit(x_cz_2,np.log(y_cz_2), 1)
        Z=np.polyval(L,x_cz_2)
        true=np.exp(Z)
        score = r2_score(y_cz_2,true, multioutput='raw_values')
        print('复合函数:'+str(score))

        new=pd.DataFrame({'标签':i,
                          '类型':'复合函数',
                          'r2':score,
                          '系数':[L]})

        df_d=df_d.append(new,ignore_index=(True))

        ##生长
        x_cz_2=jj[['自变量']].values.tolist()
        y_cz_2=jj[['因变量']].values.tolist()
        x_cz_2=sum(x_cz_2,[])
        y_cz_2=sum(y_cz_2,[])
        L=np.polyfit(x_cz_2, np.log(y_cz_2), 1)
        Z=np.polyval(L,x_cz_2)
        true=np.exp(Z)
        score = r2_score(y_cz_2,true, multioutput='raw_values')
        print('生长:'+str(score))

        new=pd.DataFrame({'标签':i,
                          '类型':'生长',
                          'r2':score,
                          '系数':[L]})

        df_d=df_d.append(new,ignore_index=(True))

        # ##三次
        # x_cz_2=jj[['自变量']].values.tolist()
        # y_cz_2=jj[['因变量']].values.tolist()
        # x_cz_2=sum(x_cz_2,[])
        # y_cz_2=sum(y_cz_2,[])
        # L=np.polyfit(x_cz_2, y_cz_2, deg=3)
        # Z=np.polyval(L,x_cz_2)
        # score = r2_score(y_cz_2,Z,multioutput='raw_values')
        # print('三次:'+str(score))

        # new=pd.DataFrame({'标签':i,
        #                   '类型':'三次',
        #                   'r2':score,
        #                   '系数':[L]})

        # df_d=df_d.append(new,ignore_index=(True))

        # ##S函数
        # x_cz_2=jj[['自变量']].values.tolist()
        # y_cz_2=jj[['因变量']].values.tolist()
        # x_cz_2=sum(x_cz_2,[])
        # x_cz_3 = [1/x for x in x_cz_2]
        # y_cz_2=sum(y_cz_2,[])
        # L=np.polyfit(x_cz_3, np.log(y_cz_2), 1)
        # Z=np.polyval(L,x_cz_3)
        # true=np.exp(Z)
        # score = r2_score(y_cz_2,true,multioutput='raw_values')
        # print('S函数:'+str(score))

        # new=pd.DataFrame({'标签':i,
        #                   '类型':'S函数',
        #                   'r2':score,
        #                   '系数':[L]})

        # df_d=df_d.append(new,ignore_index=(True))

        ##逆函数
        x_cz_2=jj[['自变量']].values.tolist()
        y_cz_2=jj[['因变量']].values.tolist()
        x_cz_2=sum(x_cz_2,[])
        x_cz_3 = [1/x for x in x_cz_2]
        y_cz_2=sum(y_cz_2,[])
        L=np.polyfit(x_cz_3, y_cz_2, 1)
        Z=np.polyval(L,x_cz_3)
        score = r2_score(y_cz_2,true,multioutput='raw_values')
        print('逆函数:'+str(score))

        new=pd.DataFrame({'标签':i,
                          '类型':'逆函数',
                          'r2':score,
                          '系数':[L]})

        df_d=df_d.append(new,ignore_index=(True))

    df_zh=df_d.sort_values('r2', ascending=False).groupby('标签', as_index=False).first()


    ff=df_zh
    # second=df_e[(df_e['类型']=='二次')]
    j=0
    while  j < len(a):
        gg=ff.iloc[[j]].values.tolist()
        gg =sum(gg,[])


        if gg[1] == '二次':
            x=fw
            y_sh=gg[3][0]*x**2+gg[3][1]*x+gg[3][2]
            formu_s='y='+str(gg[3][0])+str('x^2+')+str(gg[3][1])+str('x')+str('+(')+str(gg[3][2])+str(')')
        elif gg[1] == '线性':
            x=fw
            y_sh=gg[3][0]*x+gg[3][1]
            formu_s='y_zh='+str(gg[3][0])+str('x')+str('+(')+str(gg[3][1])+str(')')
        elif gg[1] == '指数':
            x=fw
            y_sh=np.exp(gg[3][0]*x+gg[3][1])
            formu_s='y='+str(np.exp(gg[3][1]))+str('e')+'^'+str(gg[3][0]) +'x'
        elif gg[1] == '幂函数':
            x=fw
            y_sh=np.exp(gg[3][1]+(np.log(x)*gg[3][0]))
            formu_s='y='+str(np.exp(gg[3][1]))+str('x')+'^'+str(gg[3][0])
        elif gg[1] == '对数':
            x=fw
            y_sh=gg[3][1]+(np.log(x)*gg[3][0])
            formu_s='y='+str(gg[3][1])+'+'+str(gg[3][0])+'In(x)'
        elif gg[1] == '生长':
            x=fw
            y_sh=np.exp(gg[3][0]*x+gg[3][1])
            formu_s='y='+'e^('+str(gg[3][0])+str('x')+str('+(')+str(gg[3][1])+str('))')
        elif gg[1] == '三次':
            x=fw
            y_sh=gg[3][0]*x**3+gg[3][1]*x**2+gg[3][2]*x+gg[3][3]
            formu_s='y='+str(gg[3][0])+str('x^3+')+str(gg[3][1])+str('x^2+')+str(gg[3][2])+str('x')+str('+(')+str(gg[3][3])+str(')')
        elif gg[1] == 'S函数':
            x=fw
            y_sh=np.exp(gg[3][0]*(x)**(-1)+gg[3][1])
            formu_s='y='+'e^('+str(gg[3][0])+str('(1/x)')+str('+(')+str(gg[3][1])+str('))')
        elif gg[1] == '逆函数':
            x=fw
            y_sh=gg[3][0]*(x)**(-1)+gg[3][1]
            formu_s='y='+str(gg[3][0])+str('(1/x)')+str('+(')+str(gg[3][1])+str(')')
        elif gg[1] == '复合函数':
            x=fw
            y_sh=np.exp(gg[3][1]+(gg[3][0]*x))
            formu_s='y='+str(np.exp(gg[3][1])) +'*'+str(np.exp(gg[3][0])) +'^x'
        gg.append(formu_s)
        del gg[3]
        gg=[gg]

        df_a=df_a.append(gg,ignore_index=(True))


        # if gg[1] == '二次':
        #     x=np.arange(0.15,0.4,0.002)
        #     y_nh=gg[3][0]*x**2+gg[3][1]*x+gg[3][2]-x
        #     formu_n='y_cz='+str(gg[3][0])+str('x^2+')+str(gg[3][1])+str('x')+str('+(')+str(gg[3][2])+str(')')+'-x'
        # elif gg[1] == '线性':
        #     x=np.arange(0.15,0.4,0.002)
        #     y_nh=gg[3][0]*x+gg[3][1]-x
        #     formu_n='y_cz='+str(gg[3][0])+str('x')+str('+(')+str(gg[3][1])+str(')')+'-x'
        # elif gg[1] == '指数':
        #     x=np.arange(0.15,0.4,0.002)
        #     y_nh=np.exp(gg[3][0]*x+np.log(gg[3][1]))-x
        #     # formu=str(gg[3][0])+str('x')+str('+(')+str(gg[3][1])+str(')')
        # else :
        #     x=np.arange(0.15,0.4,0.002)
        #     y_nh=np.exp(gg[3][0]*x+np.log(gg[3][1])) -x

        # if gg[5] == '二次':
        #     x=np.arange(0.15,0.4,0.002)
        #     y_sh=gg[7][0]*x**2+gg[7][1]*x+gg[7][2] -x
        #     formu_s='y_zh='+str(gg[7][0])+str('x^2+')+str(gg[7][1])+str('x')+str('+(')+str(gg[7][2])+str(')')+'-x'
        # elif gg[5] == '线性':
        #     x=np.arange(0.15,0.4,0.002)
        #     y_sh=gg[7][0]*x+gg[7][1] -x
        #     formu_s='y_zh='+str(gg[7][0])+str('x')+str('+(')+str(gg[7][1])+str(')')+'-x'
        # elif gg[5] == '指数':
        #     x=np.arange(0.15,0.4,0.002)
        #     y_sh=np.exp(gg[7][0]*x+np.log(gg[7][1])) -x
        # else :
        #     x=np.arange(0.15,0.4,0.002)
        #     y_sh=np.exp(ff[7][0]*x+np.log(ff[7][1])) -x


        # fig11=plt.figure(num=11,figsize=(20,17))
        # ax11=fig11.add_subplot(111)
        #调整保存图片的大小
        plt.figure(figsize=(20, 15))

        plt.plot(x,y_sh,'r-.o',label=y_因变量+formu_s+'  r2='+str(gg[0][2]),linewidth=0.05)


        plt.tick_params(labelsize=23)

        plt.xlabel(x_自变量,fontsize=40)

        plt.ylabel(y_因变量,fontsize=40)


        plt.title(str(gg[0][0])+'--'+x_自变量+'&'+y_因变量,fontsize=40) #要用plt调动title

        plt.legend(fontsize=30)


        x2=data_df[(data_df['标签']==gg[0][0])][['自变量']]
        y2=data_df[(data_df['标签']==gg[0][0])][['因变量']]


        colors2 = '#DC143C'
        area = np.pi * 6**2.7  # 点面积
        # 画散点图
        plt.scatter(x2, y2, s=area, c=colors2, alpha=0.5)
        plt.savefig('')


        plt.savefig(io_1+'/%s.jpg'%(gg[0][0]), bbox_inches='tight')
        plt.show()
        # plt.close()
        j=j+1
        if j > len(a)-1:
            break
    df_a.columns= ['标签','类型', 'r2','公式']
    return df_a
三、开始调用代码,验证成果
import pandas as pd
import numpy as  np
#需要加载的数据集
io=r'C:\Users\**\Desktop\测试集.xlsx'
data_df=pd.read_excel(io,sheet_name='测试数据集')
x_自变量='自变量'
y_因变量='因变量'
io_1=r'C:\Users\**\Desktop\临时文件'
fw=np.arange(1,100,1)


answer=analysis_of_regression(data_df,x_自变量,y_因变量,fw,io_1)
撒花,完美调用~。本篇都是原创的代码,如果代码好用请点赞!


