【python】可视化-绘制带有边权重的无向图
文章目录
-
- 需求
- 示例数据
- 代码实现
需求
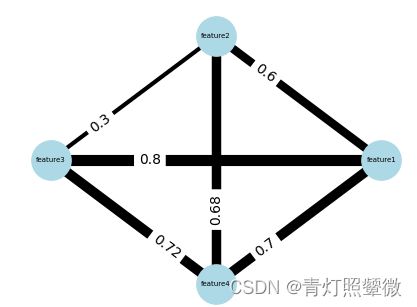
输入数据表(矩阵),绘制无向图。
示例数据
**示例数据1:**3个特征之间的关系数据 (data1.txt)
| features | feature1 | feature2 | feature3 |
|---|---|---|---|
| feature1 | 1 | 0.6 | 0.8 |
| feature2 | 0.6 | 1 | 0.3 |
| feature3 | 0.8 | 0.3 | 1 |
**示例数据2:**4个特征之间的关系数据 (data2.txt)
| features | feature1 | feature2 | feature3 | feature4 |
|---|---|---|---|---|
| feature1 | 1 | 0.6 | 0.8 | 0.7 |
| feature2 | 0.6 | 1 | 0.3 | 0.68 |
| feature3 | 0.8 | 0.3 | 1 | 0.72 |
| feature4 | 0.7 | 0.68 | 0.72 | 1 |
代码实现
import pandas as pd
import numpy as np
import networkx as nx
import matplotlib.pyplot as plt

from collections import OrderedDict
import math


def calculate_circle_points(n, r=1, center=(0, 0)):
    """
    将圆按弧线等分后, 分割点的坐标
    =========================

    Parameters
    ----------
    n: int
        等分的份数

    r: float, int, optional[1]
        圆的半径, 默认[1]

    center: tuple, optional [(0, 0)]
        圆的中心, 默认(0, 0)


    Returns
    -------
    points: list
        划分后的点坐标list
    """
    points = []
    circumference = 2 * math.pi * r  # 圆的周长

    for i in range(n):
        theta = (i / n) * circumference  # 当前等分点所对应的弧长
        x = center[0] + math.cos(theta)  # x 坐标
        y = center[1] + math.sin(theta)  # y 坐标
        points.append((x, y))

    return points


def list2dict_tuple(lst):
    """
    根据list的元素个数, 定义字典的布局
    ===============================
    布局为一个圆形

    Paramters
    ---------
    lst: list
        输入list

    Retures
    -------
    odict:
        根据list元素个数 返回每个元素位置字典
    """
    n = len(lst)  # 节点数

    # 圈上的点坐标
    circle_points = calculate_circle_points(n)

    # 坐标和点构成字典
    odict = OrderedDict()
    for node_i, point in zip(lst, circle_points):
        odict[node_i] = point

    return odict


def draw_nx_graph(matrix, outfig=None, fixed_node=False):
    """
    输入矩阵数据,绘制无向图

    Parameters
    ----------
    matrix: DataFrame
        矩阵数据
        比如, 多个特征间的相关性矩阵

    outfig: str, optional [None]
        默认None, 不输出绘图, 否则设置绘图路径

    fixed_node: bool, optional [False]
        固定节点位置
        - 特征较少时, 可设置为True
        - 特征较多时, 建议设置为False
          因为设置固定节点位置, 可能会影响节点之间的边连线或出现边的标签覆盖问题

    Returns
    -------
    None
    """
    # 画布大小
    plt.figure(figsize=(4, 3))

    # 创建空的无向图
    G = nx.Graph()

    # 添加节点
    for node in matrix.columns:
        G.add_node(node)

    # 添加边
    for row, col in zip(
        *matrix.where(pd.np.triu(pd.np.ones(matrix.shape), k=1).astype(bool)).stack().reset_index().drop(columns=0).values.T
    ):
        value = matrix.loc[row, col]
        G.add_edge(row, col, weight=value)

    # 绘制无向图
    edges = G.edges()
    weights = [G[u][v]['weight'] for u, v in edges]

    if fixed_node:
        # 固定节点位置 (特征较少时)
        nodelst = G.nodes()  # 获取节点名称list
        posdict = list2dict_tuple(nodelst)  # 根据list元素个数布局节点位置
        # posdict = {'feature1': (0, 0), 'feature2': (0, 1), 'feature3': (1, 0)}
    else: # 特征较多时
        posdict = None

    # print(posdict)

    nx.draw(
        G, pos=posdict,
        with_labels=True,
        font_size=5,  # 节点标签字体
        node_color="lightblue",  # 节点颜色
        node_size=800,
        width=np.array(weights)*10,
    )

    if fixed_node:
        labels = nx.get_edge_attributes(G, 'weight')
        nx.draw_networkx_edge_labels(
            G, posdict, edge_labels=labels,
            label_pos=0.3,
        )
        # nx.draw_networkx_edge_labels(G, pos=nx.spring_layout(G), edge_labels=labels)

    else:
        print(
            "NOTE: not fixed note pos, will not add labels of edges. "
            "And network graph will be changed, every time this script is executed."
        )

    # 输出绘图
    if outfig:
        plt.savefig(outfig)

    plt.show(block=False)
    plt.pause(1)
    plt.close()


def main(datafile, outfig=None, fixed_node=False):
    # 读取数据
    matrix = pd.read_csv(datafile, sep='\t', index_col=0)

    # 调用函数绘制无向图
    draw_nx_graph(matrix, outfig, fixed_node)
使用示例1:
datafile = './data1.txt'
# outfig = './data1.nx_grpaph.pdf'
main(datafile, fixed_node=True, outfig=None)
示例2:
datafile = './data2.txt'
# outfig = './data2.nx_grpaph.pdf'
main(datafile, fixed_node=True, outfig=None)

