Echarts 三角形柱状图有0数据时hover事件bug
效果图
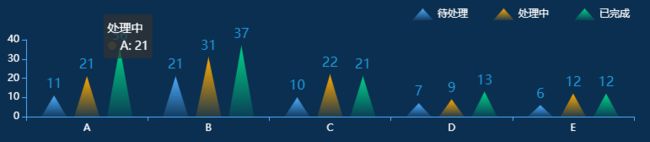
数据没有0,hover A显示正常
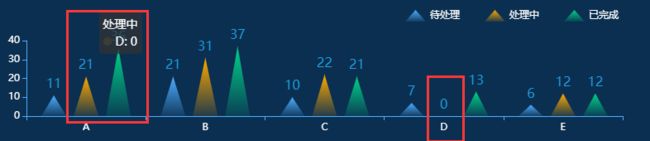
数据有0存在时,hover A显示出错
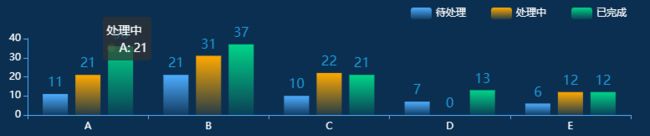
当柱状图是原始bar时,无此bug
代码:
initChart(){
    // 初始化数据
    const seriesData = [];
    const dimensions = ['product','待处理','处理中','已完成'];
    const source = [
        { product: 'A','待处理':11,'处理中':21,'已完成':36},
        { product: 'B','待处理':21,'处理中':31,'已完成':37},
        { product: 'C','待处理':10,'处理中':22,'已完成':21},
        { product: 'D','待处理':7,'处理中':0,'已完成':13},
        { product: 'E','待处理':6,'处理中':12,'已完成':12}
    ]
    const colorList = [
        {top: 'rgba(77,173,255,1)',bottom:'rgba(77,173,255,.1)'},
        {top: 'rgba(255,169,0,1)',bottom:'rgba(255,169,0,.1)'},
        {top: 'rgba(0,212,136,1)',bottom:'rgba(0,212,136,.1)'},
    ]
    dimensions.forEach((item,index) => {
        if (item === 'product') return
        seriesData.push({
            type: 'pictorialBar', // bar时无此bug
            symbol:'triangle',
            barWidth: 30,
            barGap: '30%',
            itemStyle: {
                normal: {
                    color: new echarts.graphic.LinearGradient(0, 1, 0, 0, [{
                        offset: 0,
                        color: colorList[index - 1].bottom
                    }, {
                        offset: 1,
                        color: colorList[index -1].top
                    }]),
                    label: {
                        show: true,
                        position: 'top',
                        textStyle: {
                            color: '#1F9FE2',
                            fontSize: 16
                        }
                    }
                }
            }
        })
    })

    const myChart = echarts.init(document.querySelector('#app'));
    const option = {
        grid:{
            x: 40,
            y: 50,
            x2: 20,
            y2: 30
        },
        legend: {
            right: '20',
            top: '8',
            itemGap: 30,
            textStyle: {
                color: '#fff'
            }
        },
        tooltip: {},
        dataset: {
            dimensions,
            source
        },
        xAxis: {
            type: 'category',
            axisLine: {
                lineStyle: {
                    color: "#4DADFF",
                }
            },
            axisLabel: {
                show: true,
                textStyle: {
                    color: '#fff'
                }
                // interval:0,
                // rotate:60
            },
            splitLine:{
                show:false
            }
        },
        yAxis: {
            axisLine: {
                lineStyle: {
                    color: "#4DADFF",
                }
            },
            axisLabel : {
                textStyle: {
                    color: '#fff'
                }
            },
            splitLine:{
                show:false
            }
        },
        series: seriesData
    };
    myChart.setOption(option);
    window.addEventListener('resize',() => {
        myChart.resize();
    })
}
解决方法:
暂时未解决。。。