gromacs PCA 做自由能景观图
在文献中看到有人做自由能景观图,记录下自己的操作过程
参考http://www.kangsgo.com/49.html
http://sobereva.com/73
https://www.zhihu.com/question/19895566
跑完动力学后蛋白比对
gmx trjconv -f md.xtc -s md.tpr -fit rot+trans -o mdfit.xtc
选择backbone 以及 system用于输出
然后生成协方差
gmx covar -s md.gro -f mdfit.xtc -o eigenvalues.xvg -v eigenvectors.trr -xpma covapic.xpm
选择C-alpha
这里可以用xmgrace 查看生成的
投影本征向量
gmx anaeig -f mdfit.xtc -s md.tpr -v eigenvectors.trr -first 1 -proj pc1.xvg
gmx anaeig -f mdfit.xtc -s md.gro -v eigenvectors.trr -frist 2 -last 2 -proj pc2.xvg
然后利用perl脚本合并
perl sham.pl -i1 pc1.xvg -i2 pc2.xvg -data 1 -data2 1 -o gsham_input.xvg
再使用sham工具计算Gibbs自由能:
gmx sham -f gsham_input.xvg -ls FES.xpm
用脚本xpm2txt.py转换为文本文件用origin软件做图
python2.7 xpm2txt.py -f FES.xpm -o free-energy-landscape.txt
用origin 软件作图
打开free-energy-landscape.txt,x y z 分别对应pc1 pc2 能量项,
然后点击Plot —> 3D XYZ —> 3D Scatter就好了(这步没看出来有什么用)
数据列表转换为矩阵表(Matrix)
Worksheet —> Convert to Matrix —> Direct —> Open Dialog
在弹出的对话框中的Data Format 选项中选择X across column,X values in选项中选择 First Data Row,勾选Y Valuesin First Column,保持Even Spacing Relative Tolerance (%),
这里需要注意一下,有时候Origin程序会在转换矩阵表的时候报错,一般是“ Your X data are not evenly spaced, it has fluctuation of 11.11%.Please try changing the tolerance setting.If the fluctuations are very large, you should transform yourdata to XYZ column format by Worksheet: Convert to XYZ menu and then use the matrix gridding tool. ”
遇到这种情况,一般的解决方式是增大Even Spacing Relative Tolerance (%) 值就可以了,但是往往这时候数据点的间隔会有所增大,不过一般来说不会有太大的影响。
按照教程自己的报错,重新选择了XYZ gridding,成功转换成 矩阵
Origin菜单栏上的Plot —> 3D Surface —>Color Map Surface
这样做出来粗糙的一个3D自由能景观图。
接下来是修改参数
双击绘制好的平面,在弹出的对话框Plot Details 中,选择左侧对话框中Graph - Layer【注意,是在Layer激活的状态下,如下图所示】,然后在右侧的对话框中选择Size/Speed,在下面的Worksheet data, Skip Points if needed下的数据框中填写数字:数值越大,图中的平面约光滑。自己修改为300 200 200

然后点击level, 出现set level, 修改increment, 这里自己修改为1

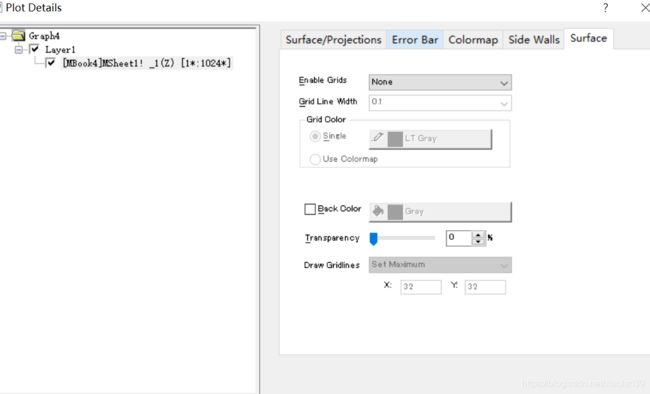
然后再点击Surface, 修改 Enable Grids–None,同时在surface/projections取消勾选contour line

然后再修改色带legend, 双击legend,弹出color scale control对话框

点击Increment,这里自己修改为20,这样色带标签就只有三个数字了,画面更简洁。
修改level 中的 Increment 时值小点,一般为0.04-0.08,total 值越多,曲线越光滑。
在色带label 中的 increment 设置为20-40(label 将会是 level 中的 0.04乘以这里的值,这样色带label 稀疏,值可以清楚的显示出来。
同时也可以做一个2D map 图,这里2Dmap 参数设置需要同3D相同,这样两者结果一致
接着我们要从自由能景观图中获取点的坐标,首先获取最低势能构象的X Y Z坐标,获取后再origin的sheet中找到,然后在gsham_input.xvg文件中找到相对应的XY坐标,gsham_input.xvg有三列值,第一列为时间(ps),第二列为X坐标,第三列为Z坐标,这样匹配到时间戳后(假设这里第45000ps结构为最低势能),从VMD中提取相对应的复合物坐标,对该结构进行详细的分析。
提取的脚本为
gmx trjconv -f md_fit.xtc -s md.tpr -dump 45000 -o representative_45000ps.pdb
看到有人问xpm2txt.py的文件,这里贴出来
#!/usr/bin/env python
import sys
"""
Utility tool to convert xpm files generated by GROMACS to a 3-column text file.
"""
USAGE = "USAGE: xpm2txt.py -f -o
USAGE+= "Options:\n"
USAGE+= "\t-s\t(int)\tSorts the output by a given column"
USAGE+= "\n" # always keep this line
# Parse arguments
read_input, read_output, sort = False, False, False
xpm_file, out_file, column_sort = None, None, None
for arg in sys.argv[1:]:
if read_input:
read_input = False
xpm_file = arg
elif read_output:
read_output = False
out_file = arg
elif sort:
sort = False
column_sort = int(arg)
if arg[0] == "-":
if arg == "-f":
read_input = True
continue
elif arg == "-o":
read_output = True
continue
elif arg == "-s":
sort = True
else:
print USAGE
sys.stderr.write('ERROR: Option not recognized: %s\n' %arg)
sys.exit(1)
if not xpm_file:
print USAGE
sys.stderr.write('ERROR: You forgot to provide an input file.\n')
sys.exit(1)
if not out_file:
out_file = "out.txt"
# Parse XPM file
xpm_handle = open(xpm_file)
xpm_data = []
x_axis, y_axis = [], []
letter_to_value = {}
for line in xpm_handle:
if line.startswith("/* x-axis"):
x_axis = map(float, line.split()[2:-2]) # We trim the last value
if line.startswith("/* y-axis"):
y_axis = map(float, line.split()[2:-2]) # We trim the last value
if line.startswith('"') and x_axis and y_axis: # Read data
xpm_data.insert(0, line.strip().strip(',')[1:-1])
if line.startswith('"') and len(line.split()) > 4:
letter = line.split()[0][1:]
value = float(line.split()[-2][1:-1])
letter_to_value[letter] = value
xpm_handle.close()
# Match x/y/data
txt_values = []
for y_index, data_value in enumerate(xpm_data):
y_value = y_axis[y_index]
for x_index, x_value in enumerate(x_axis):
txt_values.append([x_value, y_value, letter_to_value[data_value[x_index]]])
# Apply sorting if requested
if column_sort:
try:
txt_values.sort(key=lambda x: x[column_sort-1])
except IndexError:
print USAGE
sys.stderr.write('ERROR: Column not found (%s)\n' %(column_sort))
sys.exit(1)
# Print to file
out_handle = open(out_file, 'w')
for x, y, z in txt_values:
out_handle.write("%3.5f\t%3.5f\t%3.5f\n" %(x,y,z))
out_handle.close()
以及sham.pl perl脚本合并PC1和PC2.
#!/usr/bin/perl -w
# This program reads in two .xvg files (specified on the command line) and prints out a
# concatenated output file suitable for input into g_sham for generating free energy landscapes.
# The output line contains, for example: time value1 value2
#
# Caveat 1 (should be obvious): both input files must contain the same number of data points
# Caveat 2: the desired quantity should be the second item on the line in the .xvg file (after time)
#
# Values of -data1 and -data2 are the number of the data set in the input .xvg file(s), i.e. 0 would
# be the first column (usually time), 1 would be the first data set, etc.
use strict;
unless (@ARGV) {
die "Usage: perl sham.pl -i1 input1.xvg -i2 input2.xvg -data1 1 -data2 1 -o graph.xvg\n";
}
my %args = @ARGV;
# define input and output files
my $input1;
my $input2;
my $output;
if (exists($args{"-i1"})) {
$input1 = $args{"-i1"};
} else {
die "No -i1 specified!\n";
}
if (exists($args{"-i2"})) {
$input2 = $args{"-i2"};
} else {
die "No -i2 specified!\n";
}
if (exists($args{"-o"})) {
$output = $args{"-o"};
} else {
$output = "graph.xvg"; # default output name
}
# define input data sets
my $d1;
my $d2;
if (exists($args{"-data1"})) {
$d1 = $args{"-data1"};
} else {
$d1 = 1; # default to first non-time data column
}
if (exists($args{"-data2"})) {
$d2 = $args{"-data2"};
} else {
$d2 = 1;
}
open(IN1, "<$input1") || die "$!: Cannot open $input1";
my @in1 =