利用DevExpress的WebChartControl绘制直方图,折线图和饼状图
开发工具:VS 2010+DevExpress控件forC#-8[1].2,后者是我在csdn.net上下载的,具体下载地址为http://download.csdn.net/detail/fos007/3685946
1、解压“ DevExpress控件forC#-8[1].2 ”文件会有一系列的dll文件,将涉及到DevExpress.XtraCharts的命名空间和子空间作为引用添加到解决方案中来。
2、工具箱-选择工具箱项-浏览到DevExpress.XtraCharts.v8.2.Web.dll添加
3、添加工具箱中出现的WebChartControl控件三个,分别用来显示直方图,饼状图和折线图。在代码文件中添加命名空间using DevExpress.XtraCharts.Web;
using DevExpress.XtraCharts; //Series,SeriesPoint属于该类的。
4、为图形创建数据源,以DataTable数据源作为示例,该DataTable包含三列,week星期与money金额,cost成本,代码如下
public DataTable GetDataSource
{
get
{
DataTable dt = new DataTable();
dt.Columns.Add("week", typeof(string));
dt.Columns.Add("money", typeof(decimal));
dt.Columns.Add("cost", typeof(decimal));
dt.Rows.Add("星期一", 1200, 800);
dt.Rows.Add("星期二", 1500, 1000);
dt.Rows.Add("星期三", 1400, 850);
dt.Rows.Add("星期四", 1450, 950);
dt.Rows.Add("星期五", 1300, 900);
dt.Rows.Add("星期六", 1325, 870);
dt.Rows.Add("星期日", 1400, 890);
return dt;
}
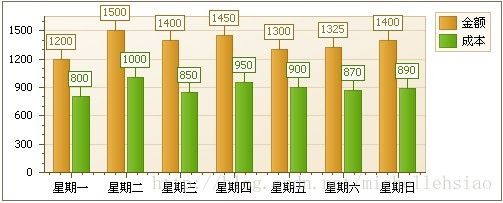
}5.1 创建柱形图
protected void Page_Load(object sender, EventArgs e)
{
Series series = new Series("金额", ViewType.Bar);
Series series_cost = new Series("成本", ViewType.Bar);
SeriesPoint point;
DataTable dt = GetDataSource;
for (int i = 0; i < dt.Rows.Count; i++)
{
point = new SeriesPoint(dt.Rows[i]["week"].ToString(), Convert.ToDouble(dt.Rows[i]["money"].ToString()));
series.Points.Add(point);
point = new SeriesPoint(dt.Rows[i]["week"].ToString(), Convert.ToDouble(dt.Rows[i]["cost"].ToString()));
series_cost.Points.Add(point);
}
this.WebChartControl1.Series.Add(series);
this.WebChartControl1.Series.Add(series_cost);
}//注:一个Series对象,就代表图形中的一项数据,一个SeriesPoint对象,就代表项数据中的一个数据点,有了这两项理解,我们要再增加数据项,就非常简单了。
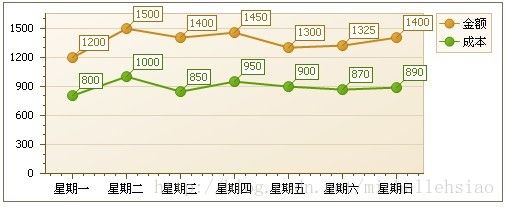
5.2 创建折线图
protected void Page_Load(object sender, EventArgs e)
{
Series series = new Series("金额", ViewType.Line);
Series series_cost = new Series("成本", ViewType.Line);
SeriesPoint point;
DataTable dt = GetDataSource;
for (int i = 0; i < dt.Rows.Count; i++)
{
point = new SeriesPoint(dt.Rows[i]["week"].ToString(), Convert.ToDouble(dt.Rows[i]["money"].ToString()));
series.Points.Add(point);
point = new SeriesPoint(dt.Rows[i]["week"].ToString(), Convert.ToDouble(dt.Rows[i]["cost"].ToString()));
series_cost.Points.Add(point);
}
this.WebChartControl1.Series.Add(series);
this.WebChartControl1.Series.Add(series_cost);
}
5.2 创建饼图
Series series = new Series("金额", ViewType.Pie);
Series series_cost = new Series("成本", ViewType.Pie);

5.4 创建混合图
现在我们将金额的数据以线状显示,将成本的数据以柱状显示,改写Series对象的类型如下:
Series series = new Series("金额", ViewType.Line);
Series series_cost = new Series("成本", ViewType.Bar);

本文主要内容转自:http://www.lmwlove.com/ac/ID816,经过少许的编辑加工,在实际代码中成功测试运行过。