Kelper.js 笔记 python交互
1 加载Kepler 地图
KeplerGl()
1.1 主要参数
| height | 可选 默认值:400 地图显示的高度 |
| data | 数据集 字典,键是数据集的名称 |
| config | 地图配置字典 |
1.2 举例
from keplergl import KeplerGl

map_=KeplerGl()
map_
默认的位置
1.3 添加自己的图
1.3.1 读取数据
数据集笔记:OpenCelliD(手机基站开放数据库)_UQI-LIUWJ的博客-CSDN博客
import pandas as pd
celltable=pd.read_csv('OpenCellID_SG.csv',header=None,
            names=['radio','mcc','net','area','cell','unit',
                  'lon','lat','range','samples','changeable1',
                  'created1','updated','AveSignal'])
celltable
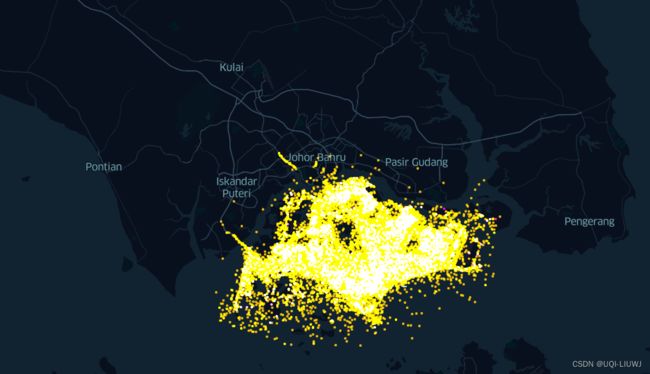
1.3.2 生成交互图
map_=KeplerGl(height=500,
             data={'celltable':celltable}
             )
map_
2 添加别的数据
.add_data()
2.1 主要参数
| data | CSV、GeoJSON 或 DataFrame |
| name | 数据条目的名称 |
2.2 举例
cell2=pd.read_csv('celltable.csv')
cell2
map_.add_data(data=cell2,name='Data2')
map_3 保存和加载配置
3.1 保存配置
#2.2的map
map_.config
{'version': 'v1',
 'config': {'visState': {'filters': [],
   'layers': [],
   'interactionConfig': {'tooltip': {'fieldsToShow': {},
     'compareMode': False,
     'compareType': 'absolute',
     'enabled': True},
    'brush': {'size': 0.5, 'enabled': False},
    'geocoder': {'enabled': False},
    'coordinate': {'enabled': False}},
   'layerBlending': 'additive',
   'splitMaps': [],
   'animationConfig': {'currentTime': None, 'speed': 1}},
  'mapState': {'bearing': 0,
   'dragRotate': False,
   'latitude': 1.2723803733955992,
   'longitude': 103.84866046448744,
   'pitch': 0,
   'zoom': 12.54617265474927,
   'isSplit': False},
  'mapStyle': {'styleType': 'dark',
   'topLayerGroups': {},
   'visibleLayerGroups': {'label': True,
    'road': True,
    'border': False,
    'building': True,
    'water': True,
    'land': True,
    '3d building': False},
   'threeDBuildingColor': [9.665468314072013,
    17.18305478057247,
    31.1442867897876],
   'mapStyles': {}}}}
3.2 加载配置
config = {
    'version': 'v1',
    'config': {
        'mapState': {
            'latitude': 37.76209132041332,
            'longitude': -122.42590232651203,
            'zoom': 12.32053899007826
        }
        ...
    }
},
map_1.add_data(data=celltable, name='data_1')
map_1.config = config
加载地图的时候直接加载配置
map_1 = KeplerGl(height=400, data={'data_1': my_df}, config=config)3.3配置匹配原则
所有图层、过滤器和工具提示都与特定数据集相关联。因此,地图中的数据和配置必须能够相互匹配。数据集的名称被分配给:
layer.config的dataId- 过滤器的
dataId interactionConfig.tooltip.fieldToShow中的键。
3.4 保存html
.save_to_html()
- data(可选):一个数据字典 {"name": data},如果未提供,将使用当前地图数据
- config(可选):地图配置字典,如果未提供,将使用当前地图配置
- file_name(可选):html 文件名,默认为 keplergl_map.html
- read_only(可选):如果 read_only 为 True,隐藏侧面面板以禁用地图自定义


