ggplot2 -- geom_linerange 函数的简单使用
brief
需要三个参数确定一个直线,x轴位置,y轴起始位置,y轴结束位置。
有别于一些垂直辅助线,可以实现柱状图,瓷砖图等等。
example
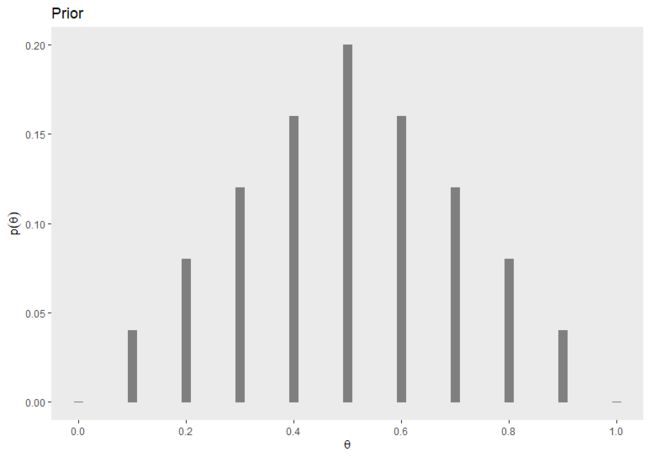
实现柱状图
library(tidyverse)

tibble(theta = seq(from = 0, to = 1, by = .1),
       prior = c(seq(from = 0, to = .2, length.out = 6),
                 seq(from = .16, to = 0, length.out = 5))) %>%

  ggplot(aes(x = theta, ymin = -0.0005, ymax = prior)) +
  geom_linerange(linewidth = 4, color = "grey50") +
  scale_x_continuous(expression(theta), breaks = seq(from = 0, to = 1, by = .2)) +
  labs(title = "Prior",y = expression(p(theta))) +
  theme(panel.grid = element_blank())
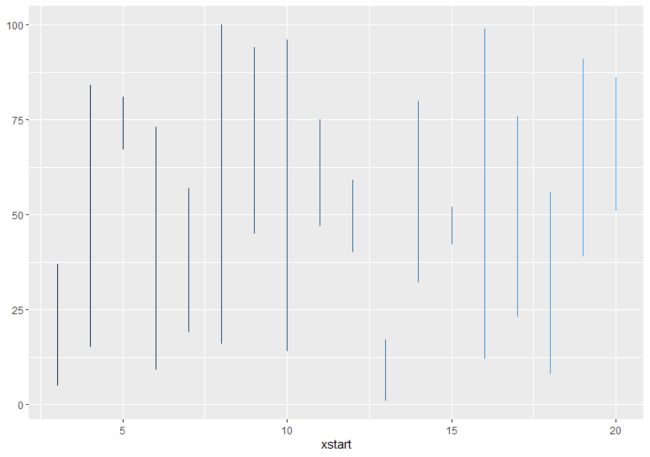
实现一些线段
tibble(xstart = seq(from = 3,to = 20,by = 1),
       ymin = rep(0,18),
       ymax = seq(from = 8,to = 25,by = 1)) %>%
  ggplot(aes(x = xstart,ymin = ymin,ymax = ymax))+
  geom_linerange(aes(colour = xstart))+
  theme(legend.position = 0)

- 反转坐标轴
tibble(xstart = seq(from = 3,to = 20,by = 1),
       ymin = rep(0,18),
       ymax = seq(from = 8,to = 25,by = 1)) %>%
  ggplot(aes(x = xstart,ymin = ymin,ymax = ymax))+
  geom_linerange(aes(colour = xstart))+
  theme(legend.position = 0)+
  coord_flip()

- 极化坐标轴
tibble(xstart = seq(from = 3,to = 20,by = 1),
       ymin = rep(0,18),
       ymax = seq(from = 8,to = 25,by = 1)) %>%
  ggplot(aes(x = xstart,ymin = ymin,ymax = ymax))+
  geom_linerange(aes(colour = xstart))+
  theme(legend.position = 0)+
  coord_polar(theta = 'y')

实现瓷砖图
tibble(xstart = seq(from = 3,to = 20,by = 1),
       ymin = sample(seq(0,100),18),
       ymax = sample(seq(0,100),18)) %>%
  ggplot(aes(x = xstart,ymin = ymin,ymax = ymax))+
  geom_linerange(aes(colour = xstart))+
  theme(legend.position = 0)
tibble(xstart = seq(from = 3,to = 20,by = 1),
       ymin = sample(seq(0,100),18),
       ymax = sample(seq(0,100),18)) %>%
  ggplot(aes(x = xstart,ymin = ymin,ymax = ymax))+
  geom_linerange(aes(colour = xstart),linewidth=4)+
  theme(legend.position = 0)
