consulmanage使用
一、监控自建主机
需要在所有被监控的主机上部署node_exporter收集主机的监控数据
在此页面下载node_exporter安装包
Download | Prometheus

下载后解压安装包,并启动node_exporter服务
mkdir /opt/node_exporter && cd /opt/node_exporter
tar -zxvf node_exporter-1.6.1.linux-amd64.tar.gz
cd node_exporter-1.6.1.linux-amd64
./node_exporter
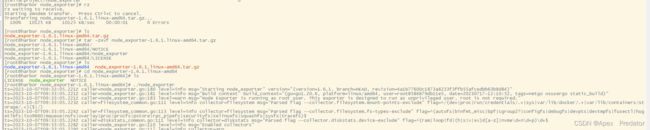
查看node_exporter服务是否正常
netstat -tlpn |grep 9100
![]()
在consulmanage web中创建需要监控的主机
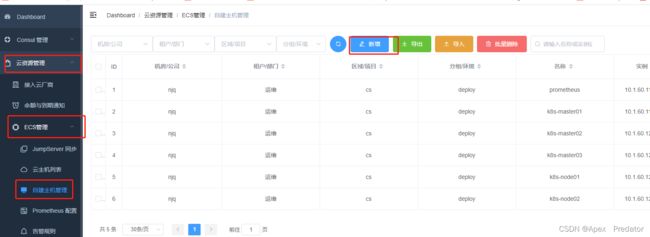

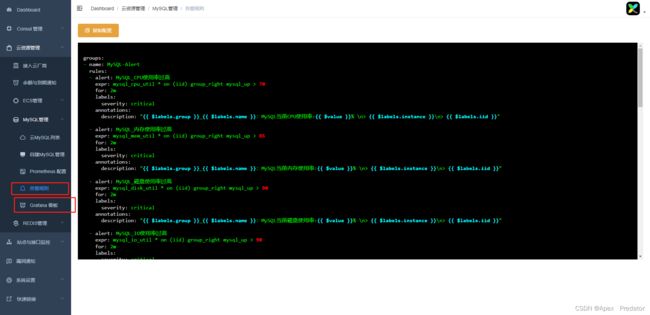
创建好后配置prometheus的监控规则
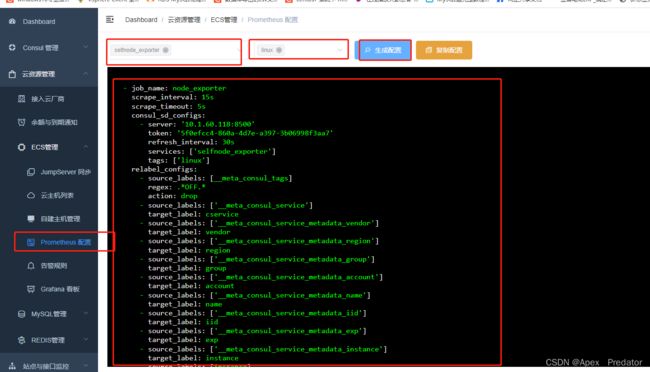 将以上consulmanage生成的Prometheus监控规则写入prometheus的配置文件中
vi /opt/prometheus/prometheus/prometheus.yml

重启prometheus服务
systemctl restart prometheus
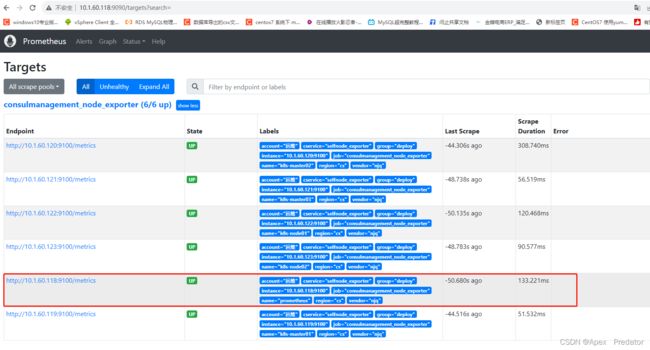
查看prometheus web服务
关于主机的Prometheus告警规则还有grafana页面展示在consulmanage web均有说明教程

二、监控自建mysql
在需要被监控的数据库中创建一个专门用于获取监控的用户(多个数据库用统一的监控用户)
CREATE USER 'monitoring'@'%' IDENTIFIED BY '11111111' ;
GRANT PROCESS, REPLICATION CLIENT, SELECT ON *.* TO 'monitoring'@'%';
flush privileges;
部署mysqld_exporter服务用于获取数据库监控数据(可以部署到Prometheus的宿主机上)
用docker-compose的方式部署,需要先安装docker和docker-compose服务(这里不在演示)
mkdir /opt/mysql_exporter
vi /opt/mysql_exporter/docker-compose.yml
version: "3.2"
services:
  mysqld_exporter:
    image: swr.cn-south-1.myhuaweicloud.com/starsl.cn/mysqld_exporter:latest
    container_name: mysqld_exporter
    hostname: mysqld_exporter
    restart: always
    ports:
      - "9104:9104"
    volumes:
      - /usr/share/zoneinfo/PRC:/etc/localtime
    environment:
      MYSQLD_EXPORTER_PASSWORD: 11111111   #填入数据库监控用户的密码
    entrypoint:
      - /bin/mysqld_exporter
      - --collect.info_schema.innodb_metrics
      - --collect.info_schema.tables
      - --collect.info_schema.processlist
      - --collect.info_schema.tables.databases=*
      - --mysqld.username=monitoring    #填入数据库监控用户的名称
启动mysql_exporter服务
cd /opt/mysql_exporter
docker-compose up -d
查看服务是否正常
netstat -tlpn |grep 9104
![]()
在consulmanage web中添加需要监控的mysql
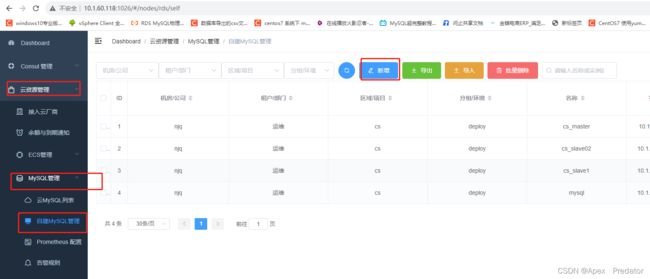
填写数据库地址和端口信息 
生成Prometheus监控的配置(填写mysql_exporter服务的地址和端口)
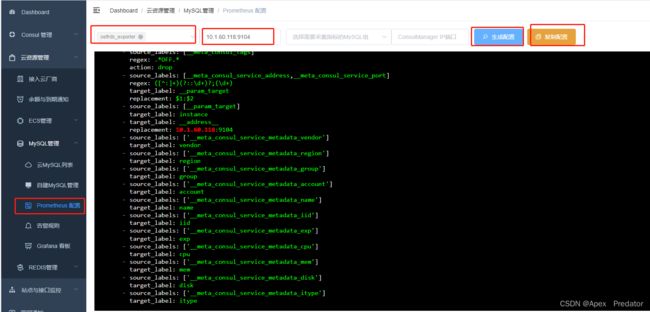
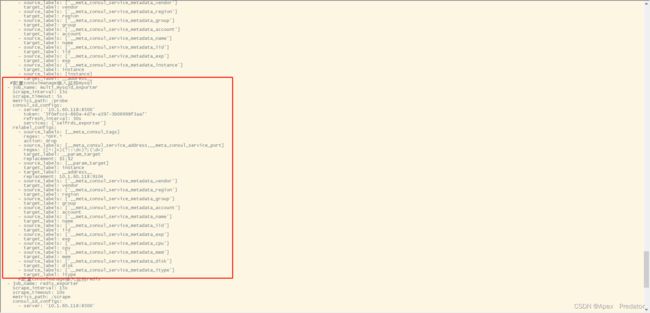
将生成的Prometheus配置填入到prometheus配置文件中,需要注意格式,填写在scrape_configs:配置项下
vi /opt/prometheus/prometheus/prometheus.yml
重启Prometheus服务
systemctl restart prometheus
查看prometheus监控是否生效
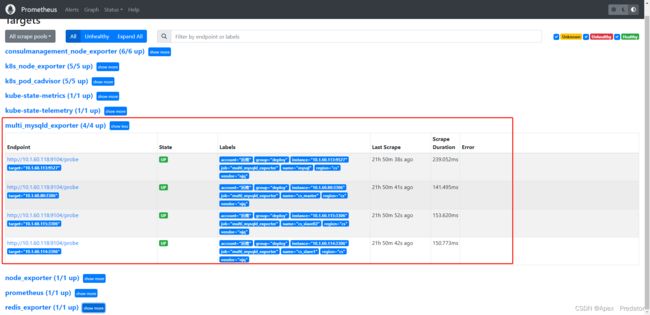
关于Prometheus对mysql监控的告警规则和grafana数据展示可以参考consulmanage配置
三、监控redis
部署redis_exporter服务获取被监控redis的数据(部署在prometheus的宿主机上即可)
mkdir /opt/redis_exporter
vi /opt/redis_exporter/docker-compose.yml
version: "3.2"
services:
  redis-exporter:
    image: oliver006/redis_exporter
    container_name: redis-exporter
    restart: unless-stopped
    command:
      - "-redis.password-file=/redis_passwd.json"
    volumes:
      - /usr/share/zoneinfo/PRC:/etc/localtime
      - /data/redis-exporter/redis_passwd.json:/redis_passwd.json
    expose:
      - 9121
    network_mode: "host"
新建一个redis的实例地址与密码文件
vi /opt/redis_exporter/redis_passwd.json
{
  "redis://10.1.60.113:6379":"11111111"    #填写redis的地址端口和密码,redis密码可以看自己的redis配置文件
}
使用docker-compose启动redis-exporter服务
cd /opt/redis_exporter
docker-compose up -d
查看redis-exporter服务是否正常
netstat -tlpn |grep 9121
![]()
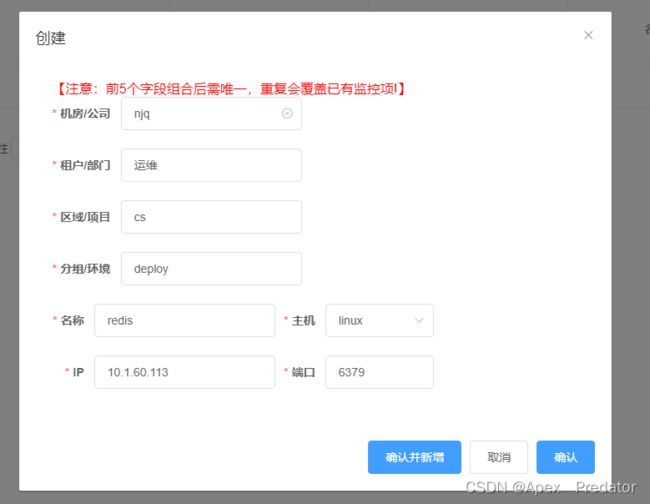
在consulmanage web中添加需要监控的redis服务
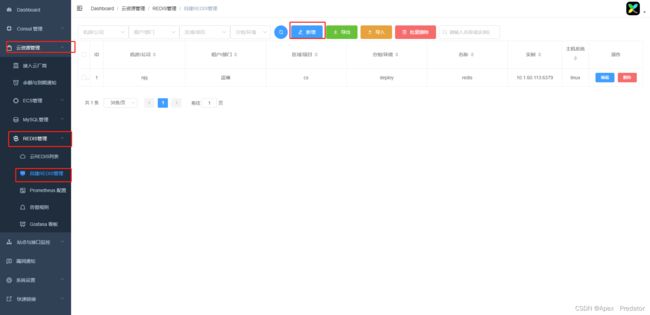
填写redis服务地址端口信息
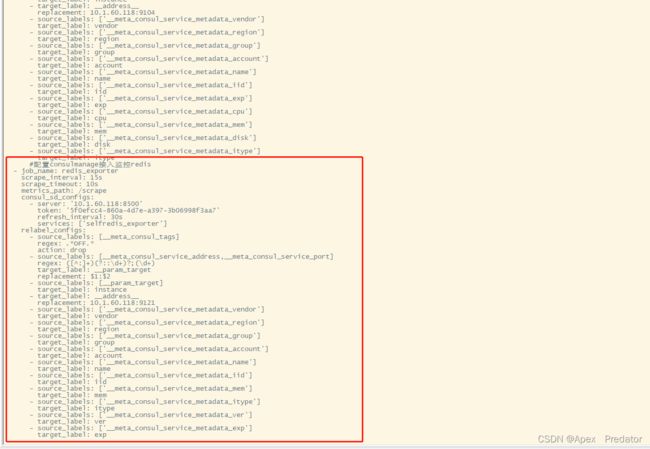
生成Prometheus配置

将生成的prometheus配置写入到Prometheus配置文件中
vi /opt/prometheus/prometheus/prometheus.yml
重启Prometheus服务
systemctl restart prometheus
查看prometheus监控是否生效
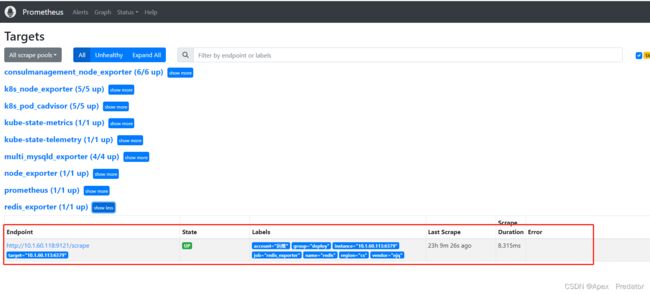
关于Prometheus对redis监控的告警规则和grafana数据展示可以参考consulmanage配置

四、站点接口监控
需要先部署blackbox-exporter服务用于收集监控数据,部署在prometheus的宿主机中
下载blackbox-exporter安装包,在prometheus下载中找
路径:Download | Prometheus
mkdir /opt/blackbox_exporter && cd /opt/blackbox_exporter
将安装包放入该目录下并解压
tar -zxvf blackbox_exporter-0.24.0.linux-amd64.tar.gz
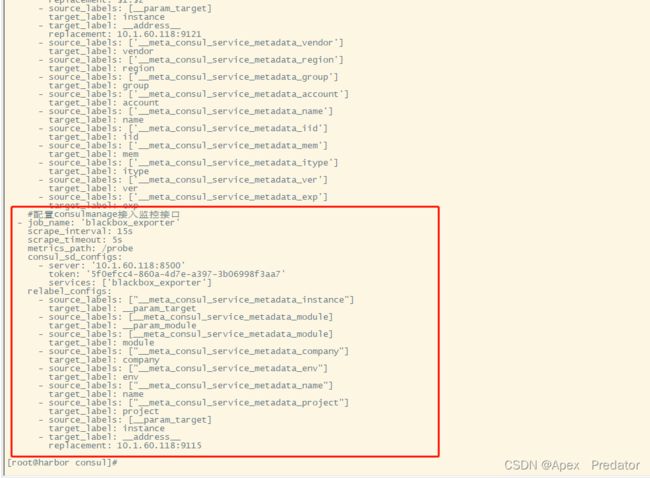
更改blackbox_exporter的配置文件,直接按照consulmanage给出的配置更改

vi blackbox_exporter-0.24.0.linux-amd64/blackbox.yml

启动blackbox-exporter服务
cd blackbox_exporter-0.24.0.linux-amd64
./blackbox_exporter &
检查blackbox-exporter服务是否启动
netstat -tlpn |grep 9115
配置prometheus配置文件

将以上的配置复制后,添加到Prometheus的配置文件中,并修改以上的地址
vi /opt/prometheus/prometheus/prometheus.yml
重启prometheus服务
systemctl restart prometheus
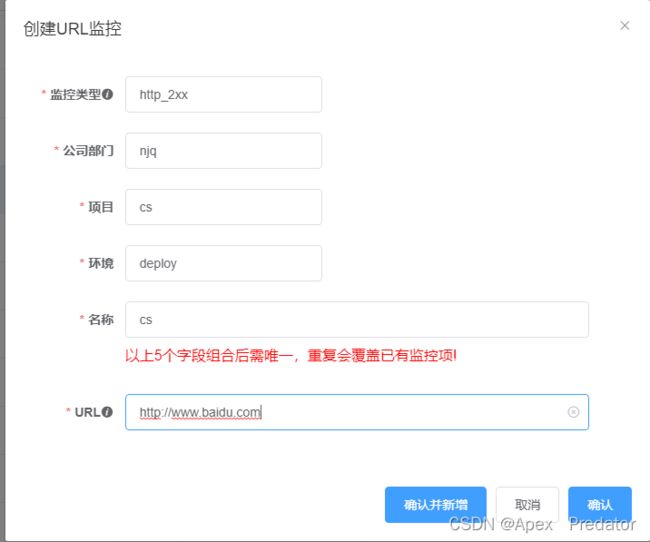
在consulmanage web上增加监控的站点或接口
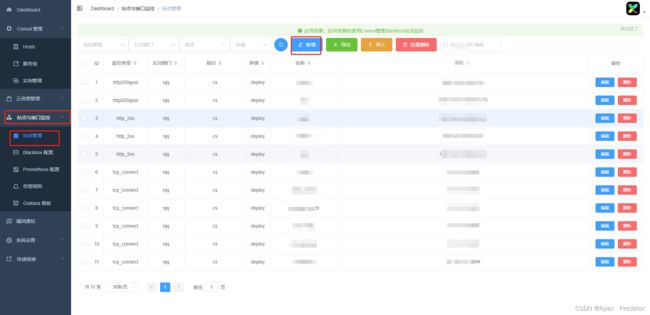
有多种监控类型,可以监控http状态、主机是否在线、ssl证书剩余时间、tcp端口是否正常,通常用的就是 http_2xx、http200igssl、tcp_connect,分别是监控http状态,监控ssl证书,tcp端口监控
添加后可以在Prometheus中查看是否正常
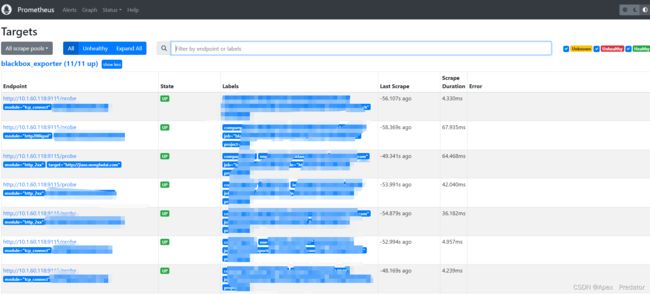
关于Prometheus对站点和接口的监控的告警规则和grafana数据展示可以参考consulmanage配置
