TS使用echarts柱状图鼠标放上去并弹出
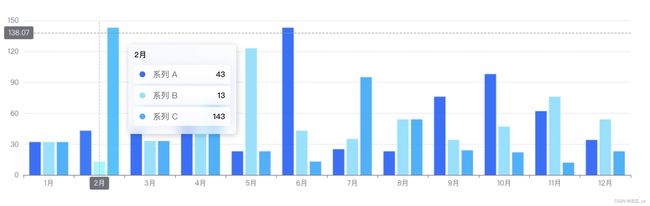
效果
代码
<template>
  <div>
   <Chart style="width: 100%; height: 344px" :option="chartOption" />
  </div>
</template>

<script lang="ts" setup>
  import { ref } from 'vue';

  import { ToolTipFormatterParams } from '@/types/echarts';

  const tooltipItemsHtmlString = (items: ToolTipFormatterParams[]) => {
    return items
      .map(
        (el) => `

      ${
        el.color
      }" class="tooltip-item-icon">

      ${el.seriesName}


      ${Number(el.value).toLocaleString()}

  `
      )
      .join('');
  };

  const xAxis = ref<string[]>([
    '1月',
    '2月',
    '3月',
    '4月',
    '5月',
    '6月',
    '7月',
    '8月',
    '9月',
    '10月',
    '11月',
    '12月',
  ]);

  const aseries = ref<number[]>([
    32, 43, 43, 53, 23, 143, 25, 23, 76, 98, 62, 34,
  ]);
  const bseries = ref<number[]>([
    32, 13, 33, 53, 123, 43, 35, 54, 34, 47, 76, 54,
  ]);
  const cseries = ref<number[]>([
    32, 143, 33, 73, 23, 13, 95, 54, 24, 22, 12, 23,
  ]);
  const chartOption = {
    grid: {
      left: '3%', // 调整左边距
      right: '3%', // 调整右边距
      top: '20',
      bottom: '60',
    },
    color: ['#246EFF', '#81E2FF', '#00B2FF'],
    tooltip: {
      show: true, // 启用提示框
      trigger: 'axis', // 触发类型为坐标轴
      axisPointer: {
        type: 'cross', // 坐标轴指示器类型
      },
      formatter: (params: ToolTipFormatterParams[]) => {
        // 定义提示框的内容格式
        const [firstElement] = params as ToolTipFormatterParams[];
        return `
          ${firstElement.axisValueLabel}
          ${tooltipItemsHtmlString(params as ToolTipFormatterParams[])}
        `;
      },
      className: 'echarts-tooltip-diy',
    },
    xAxis: {
      type: 'category',
      data: xAxis.value,
    },
    yAxis: {
      type: 'value',
    },
    series: [
      {
        name: '系列 A',
        data: aseries.value,
        type: 'bar',
      },
      {
        name: '系列 B',
        data: bseries.value,
        type: 'bar',
      },
      {
        name: '系列 C',
        data: cseries.value,
        type: 'bar',
      },
    ],
  };
</script>

<style scoped lang="less">

</style>