Flume 的应用10(Flume 数据流监控Ganglia)
文章目录
-
-
- 8、Flume 数据流监控
-
- 8.1 Ganglia的安装与部署
- 8.2 操作Flume测试监控
-
8、Flume 数据流监控
8.1 Ganglia的安装与部署
1)三台机器安装epel源
[xiaoxq@hadoop105 flume-1.9.0]$ sudo yum install -y epel-release
2) 在105安装web,meta和monitor
[xiaoxq@hadoop105 flume-1.9.0]$ sudo yum -y install ganglia-gmetad ganglia-web ganglia-gmond
3) 在106、107安装monitor
[xiaoxq@hadoop106 flume-1.9.0]$ sudo yum -y install ganglia-gmond

[xiaoxq@hadoop107 flume-1.9.0]$ sudo yum -y install ganglia-gmond
- Ganglia 由 gmond、gmetad 和 gweb 三部分组成。
- gmond(Ganglia Monitoring Daemon)是一种轻量级服务,安装在每台需要收集指标数据的节点主机上。使用 gmond,你可以很容易收集很多系统指标数据,如CPU、内存、磁盘、网络和活跃进程的数据等。
- gmetad(Ganglia Meta Daemon)整合所有信息,并将其以RRD格式存储至磁盘的服务。
- gweb(Ganglia Web)Ganglia可视化工具,gweb是一种利用浏览器显示gmetad所存储数据的PHP前端。在Web界面中以图表方式展现集群的运行状态下收集的多种不同指标数据。
4)修改配置文件/etc/httpd/conf.d/ganglia.conf
[xiaoxq@hadoop105 flume-1.9.0]$ sudo vim /etc/httpd/conf.d/ganglia.conf
- 修改为物理机IP的配置:
#
# Ganglia monitoring system php web frontend
#

Alias /ganglia /usr/share/ganglia

<Location /ganglia>
  #Require local
  #修改为自己物理机的ip
  Require ip 192.168.6.1
  # Require ip 10.1.2.3
  # Require host example.org
</Location>
5)修改配置文件/etc/ganglia/gmetad.conf
[xiaoxq@hadoop105 flume-1.9.0]$ sudo vim /etc/ganglia/gmetad.conf
- 修改为:
data_source "hadoop105" hadoop105

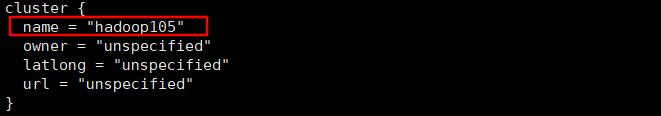
6)修改配置文件/etc/ganglia/gmond.conf
[xiaoxq@hadoop105 flume-1.9.0]$ sudo vim /etc/ganglia/gmond.conf
- 修改为:
cluster {
  name = "hadoop105"	#需要修改
  owner = "unspecified"
  latlong = "unspecified"
  url = "unspecified"
}
udp_send_channel {
  #bind_hostname = yes # Highly recommended, soon to be default.
                       # This option tells gmond to use a source address
                       # that resolves to the machine's hostname.  Without
                       # this, the metrics may appear to come from any
                       # interface and the DNS names associated with
                       # those IPs will be used to create the RRDs.
  # mcast_join = 239.2.11.71	#注释掉
  host = hadoop105		#需要修改
  port = 8649
  ttl = 1
}
udp_recv_channel {
  # mcast_join = 239.2.11.71	#注释掉
  port = 8649
  bind = 0.0.0.0		#需要修改
  retry_bind = true
  # Size of the UDP buffer. If you are handling lots of metrics you really
  # should bump it up to e.g. 10MB or even higher.
  # buffer = 10485760
}

- 将修改后的文件同步到106,107。
[xiaoxq@hadoop105 flume-1.9.0]$ sudo /home/xiaoxq/bin/xsync /etc/ganglia/gmond.conf
7)修改配置文件/etc/selinux/config
[xiaoxq@hadoop105 flume-1.9.0]$ sudo vim /etc/selinux/config
- 修改为:
# This file controls the state of SELinux on the system.
# SELINUX= can take one of these three values:
#     enforcing - SELinux security policy is enforced.
#     permissive - SELinux prints warnings instead of enforcing.
#     disabled - No SELinux policy is loaded.
SELINUX=disabled
# SELINUXTYPE= can take one of three two values:
#     targeted - Targeted processes are protected,
#     minimum - Modification of targeted policy. Only selected processes are protected.
#     mls - Multi Level Security protection.
SELINUXTYPE=targeted
- 尖叫提示:selinux本次生效关闭必须重启,如果此时不想重启,可以临时生效之:
[xiaoxq@hadoop105 flume-1.9.0]$ sudo setenforce 0
8)105启动ganglia三个后台,106,107启动gmond
[xiaoxq@hadoop105 flume-1.9.0]$ sudo systemctl start httpd
[xiaoxq@hadoop105 flume-1.9.0]$ sudo systemctl start gmetad
[xiaoxq@hadoop105 flume-1.9.0]$ sudo systemctl start gmond
[xiaoxq@hadoop106 flume-1.9.0]$ sudo systemctl start gmond
[xiaoxq@hadoop107 flume-1.9.0]$ sudo systemctl start gmond
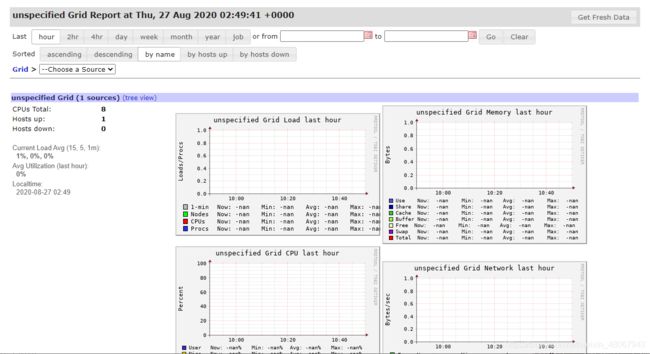
9)打开网页浏览ganglia页面
http://192.168.6.105/ganglia
- 尖叫提示:如果完成以上操作依然出现权限不足错误,请修改/var/lib/ganglia目录的权限:
[xiaoxq@hadoop105 flume-1.9.0]$ sudo chmod -R 777 /var/lib/ganglia
8.2 操作Flume测试监控
1)启动Flume任务
[xiaoxq@hadoop105 flume-1.9.0]$ bin/flume-ng agent --conf conf/ --name a1 --conf-file jobs/netcat-flume-logger.conf -Dflume.root.logger=INFO,console -Dflume.monitoring.type=ganglia -Dflume.monitoring.hosts=hadoop105:8649
2)发送数据观察ganglia监测图
[xiaoxq@hadoop105 jobs]$ nc localhost 44444
hello
OK
flume
OK
hadoop
OK
java
OK
tommy
OK
tom
OK

- 结果如图:
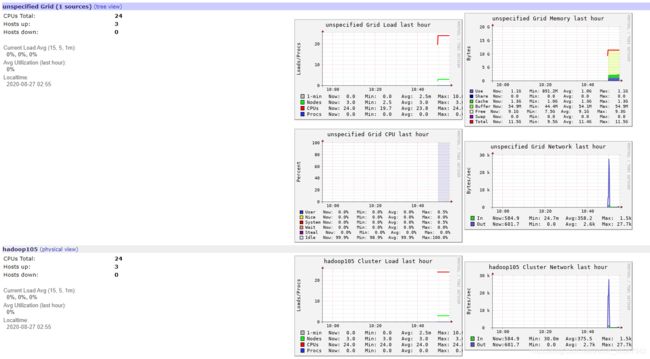
- 图例说明:
| 字段(图表名称) | 字段含义 |
|---|---|
| EventPutAttemptCount | source尝试写入channel的事件总数量 |
| EventPutSuccessCount | 成功写入channel且提交的事件总数量 |
| EventTakeAttemptCount | sink尝试从channel拉取事件的总数量。 |
| EventTakeSuccessCount | sink成功读取的事件的总数量 |
| StartTime | channel启动的时间(毫秒) |
| StopTime | channel停止的时间(毫秒) |
| ChannelSize | 目前channel中事件的总数量 |
| ChannelFillPercentage | channel占用百分比 |
| ChannelCapacity | channel的容量 |