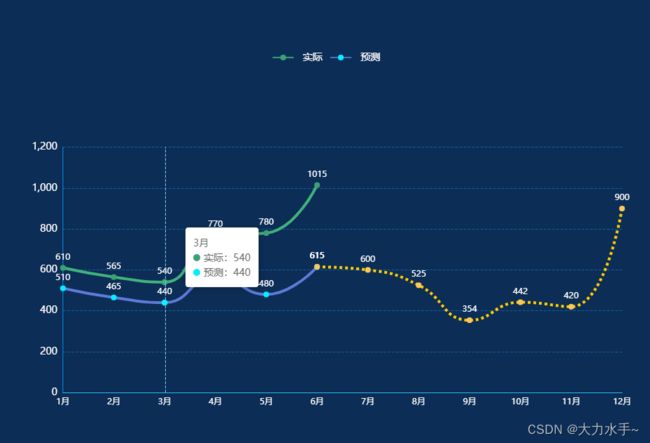
echarts折线图(预测图)预测部分为虚线,实际部分为实线(一条线一半虚线一半实线)
1.echart折线图,总共两条线,一条是实际产值的线,另一条是预测产值的线(跟实际部分是实线,超过当前日期的是虚线)ps(预测的那条线一部分显示实线一部分显示虚线)
2.完整代码
let xLabel = ['1月', '2月', '3月', '4月', '5月', '6月', '7月', '8月', '9月', '10月', '11月', '12月'];
let dataValue = [510, 465, 440, 570, 480, 615];
let dataValue2 = [610, 565, 540, 770, 780, 1015];
let dataValue1 = [...new Array(dataValue.length - 1).fill('-'), dataValue[dataValue.length - 1], 600, 525, 354, 442, 420, 900,];
let option = {
    backgroundColor: '#0c2d55',
    tooltip: {
        trigger: 'axis',
        axisPointer: {
            lineStyle: {
                color: 'rgb(126,199,255)',
            },
        },
        formatter: (params) => {
            let htmlStr = '';
            const valMap = {};
            for (let i = 0; i < params.length; i++) {
                const param = params[i];
                const xName = param.name; //x轴的名称
                const seriesName = param.seriesName; //图例名称
                const value = param.value; //y轴值
                const color = param.color; //图例颜色
                //过滤无效值
                if ((!value) || value === '-') {
                    continue;
                }

                //过滤重叠值
                if (valMap[seriesName] == value) {
                    continue;
                }

                if (i === 0) {
                    htmlStr += xName + '
'; //x轴的名称
                }
                htmlStr += '';
                //为了保证和原来的效果一样,这里自己实现了一个点的效果
                htmlStr +=
                    '';">';

                //圆点后面显示的文本
                htmlStr += seriesName + ':' + value;

                htmlStr += '';
                // 存储重复数据
                valMap[seriesName] = value;
            }
            return htmlStr;
        }
    },
    legend: {
        show: true,
        top: '10%',
        itemWidth: 30, // 图例标记的图形宽度。
        //   itemGap: 20, // 图例每项之间的间隔。
        itemHeight: 10, //  图例标记的图形高度。
        textStyle: {
            color: '#fff',
            fontSize: 14,
            padding: [0, 8, 0, 8]
        }
    },
    grid: {
        top: '30%',
        left: '10%',
        right: '5%',
        bottom: '20%',
    },
    xAxis: [
        {
            type: 'category',
            boundaryGap: false,
            axisLine: {
                //坐标轴轴线相关设置。数学上的x轴
                show: true,
                lineStyle: {
                    color: 'rgb(41,188,245)',
                },
            },
            axisLabel: {
                //坐标轴刻度标签的相关设置
                textStyle: {
                    color: '#FFFFFF',
                    fontSize: 12,
                },
            },
            splitLine: {
                show: false,
                lineStyle: {
                    color: '#233653',
                },
            },
            axisTick: {
                show: false,
            },
            data: xLabel,
        },
    ],
    yAxis: [
        {
            name: "",
            nameTextStyle: {
                color: "#fff",
                fontSize: 12,
                padding: [0, 60, 0, 0]
            },
            // minInterval: 1,
            type: 'value',
            splitLine: {
                show: true,
                lineStyle: {
                    color: '#1160a0',
                    type: 'dashed'
                },
            },
            axisLine: {
                show: true,
                lineStyle: {
                    color: '#008de7',
                },
            },
            axisLabel: {
                show: true,
                textStyle: {
                    color: '#fff',
                    fontSize: 14
                }
            },
            axisTick: {
                show: false,
            },
        },
    ],
    series: [
            {
            name: '实际',
            type: 'line',
            symbol: 'circle', // 默认是空心圆(中间是白色的),改成实心圆
            smooth:true,
            lineStyle: {
                normal: {
                    width: 3,
                    color: '#3BA272', // 线条颜色
                },
            },
            itemStyle: {
                normal: {
                    color: '#3BA272',//拐点颜色
                    // borderColor: '#fff600',//拐点边框颜色
                    // borderWidth: 13//拐点边框大小
                    label: {
                        show: true, //开启显示
                        color: '#fff',
                        position: 'top', //在上方显示
                        formatter: function (res) {
                            if (res.value) {
                                return res.value
                            } else {
                                return 0
                            }
                        },
                    },
                },

            },
            symbolSize: 8,   //设定实心点的大小
            data: dataValue2,
        },
        {
            name: '预测',
            type: 'line',
            symbol: 'circle', // 默认是空心圆(中间是白色的),改成实心圆
            smooth:true,
            lineStyle: {
                normal: {
                    width: 3,
                    color: '#5470C6', // 线条颜色
                },
            },
            itemStyle: {
                normal: {
                    color: '#00f0ff',//拐点颜色
                    // borderColor: '#fff600',//拐点边框颜色
                    // borderWidth: 13//拐点边框大小
                    label: {
                        show: true, //开启显示
                        color: '#fff',
                        position: 'top', //在上方显示
                        formatter: function (res) {
                            if (res.value) {
                                return res.value
                            } else {
                                return 0
                            }
                        },
                    },
                },

            },
            symbolSize: 8,   //设定实心点的大小
            data: dataValue,
        },
        {
            name: '预测',
            type: 'line',
            symbol: 'circle', // 默认是空心圆(中间是白色的),改成实心圆
            smooth:true,
            lineStyle: {
                normal: {
                    width: 3,
                    color: '#ffba00', // 线条颜色
                },
            },
            itemStyle: {
                normal: {
                    color: '#FAC858',//拐点颜色
                    // borderColor: '#fff600',//拐点边框颜色
                    // borderWidth: 13//拐点边框大小
                    label: {
                        show: true, //开启显示
                        color: '#fff',
                        position: 'top', //在上方显示
                        formatter: function (res) {
                            if (res.value) {
                                return res.value
                            } else {
                                return 0
                            }
                        },
                    },
                    lineStyle: {
                        type: 'dotted'
                    }
                },

            },
            symbolSize: 8,   //设定实心点的大小
            data: dataValue1,
        }
    ]
}