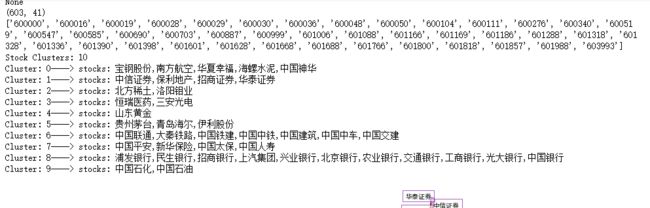
这个图看起来一团糟,但是每一部分都代表不同的含义:
1,这个图形结合了本项目的股票数据,GraphLassoCV图结构模型,近邻传播算法的分类结果,故而可以说是整个项目的结晶。
2,图中每一个节点代表一只股票,旁边有股票名称,节点的颜色表示该股票所属类别的种类,用节点颜色来区分股票所属簇群。
3,GraphLassoCV图结构模型中的稀疏逆协方差信息用节点之间的线条来表示,线条越粗,表示股票之间的关联性越强。
4,股票在图形中的位置是由2D嵌套算法来决定的,距离越远,表示其相关性越弱,簇间距离越远。


import numpy as np
import pandas as pd
import matplotlib.pyplot as plt
%matplotlib inline
np.random.seed(37) # 使得每次运行得到的随机数都一样

# 准备数据集,使用tushare来获取股票数据
# 准备几个函数,用来获取数据
import tushare as ts
def get_K_dataframe(code,start,end):
    '''get day-K data of code, from start date to end date
       params:
            code: stock code eg: 600123, 002743
            start: start date, eg: 2016-10-01
            end: end date, eg: 2016-10-31
        return:
            dataframe with columns [date, open, close, high, low]
    '''
    df=ts.get_k_data(code,start=start,end=end)
    df.drop(['volume'],axis=1, inplace=True)
    return df

def get_batch_K_df(codes_list,start,end):
    '''get batch stock K data'''
    df=pd.DataFrame()
    print('fetching data. pls wait...')
    for code in codes_list:
        # print('fetching K data of {}...'.format(code))
        df=df.append(get_K_dataframe(code,start,end))
    return df

# 数据规整函数,用于对获取的df进行数据处理
def preprocess_data(stock_df,min_K_num=1000):
    '''preprocess the stock data.
    Notice: min_K_num: the minimum stock K number.
        because some stocks was halt trading in this time period,
        the some K data was missing.
        if the K data number is less than min_K_num, the stock is discarded.'''
    df=stock_df.copy()
    df['diff']=df.close-df.open  # 此处用收盘价与开盘价的差值做分析
    df.drop(['open','close','high','low'],axis=1,inplace=True)

    result_df=None
    #下面一部分是将不同的股票diff数据整合为不同的列,列名为股票代码
    for name, group in df[['date','diff']].groupby(df.code):
        if len(group.index) stocks: {}'.format(i,','.join(np.array(selected_stocks)[labels==i]))) # 这个只有股票代码而不是股票名称
    # 下面打印出股票名称,便于观察
    stocks=np.array(selected_stocks)[labels==i].tolist()
    names=sz50_df2.loc[stocks,:].name.tolist()
    print('Cluster: {}----> stocks: {}'.format(i,','.join(names)))

from sklearn import manifold
from matplotlib.collections import LineCollection

# 对这些结果进行可视化
def visual_stock_relationship(dataset,edge_model,labels,stock_names):
    node_position_model = manifold.LocallyLinearEmbedding(
        n_components=2, eigen_solver='dense', n_neighbors=6)

    embedding = node_position_model.fit_transform(dataset.T).T

    plt.figure(1, facecolor='w', figsize=(10, 8))
    plt.clf()
    ax = plt.axes([0., 0., 1., 1.])
    plt.axis('off')

    # Display a graph of the partial correlations
    partial_correlations = edge_model.precision_.copy()
    d = 1 / np.sqrt(np.diag(partial_correlations))
    partial_correlations *= d
    partial_correlations *= d[:, np.newaxis]
    non_zero = (np.abs(np.triu(partial_correlations, k=1)) > 0.02)

    # Plot the nodes using the coordinates of our embedding
    plt.scatter(embedding[0], embedding[1], s=100 * d ** 2, c=labels,
                cmap=plt.cm.nipy_spectral)

    # Plot the edges
    start_idx, end_idx = np.where(non_zero)
    # a sequence of (*line0*, *line1*, *line2*), where::
    #            linen = (x0, y0), (x1, y1), ... (xm, ym)
    segments = [[embedding[:, start], embedding[:, stop]]
                for start, stop in zip(start_idx, end_idx)]
    values = np.abs(partial_correlations[non_zero])
    lc = LineCollection(segments,
                        zorder=0, cmap=plt.cm.hot_r,
                        norm=plt.Normalize(0, .7 * values.max()))
    lc.set_array(values)
    lc.set_linewidths(15 * values)
    ax.add_collection(lc)

    # Add a label to each node. The challenge here is that we want to
    # position the labels to avoid overlap with other labels
    n_labels=max(labels)
    for index, (name, label, (x, y)) in enumerate(
            zip(stock_names, labels, embedding.T)):

        dx = x - embedding[0]
        dx[index] = 1
        dy = y - embedding[1]
        dy[index] = 1
        this_dx = dx[np.argmin(np.abs(dy))]
        this_dy = dy[np.argmin(np.abs(dx))]
        if this_dx > 0:
            horizontalalignment = 'left'
            x = x + .001
        else:
            horizontalalignment = 'right'
            x = x - .001
        if this_dy > 0:
            verticalalignment = 'bottom'
            y = y + .001
        else:
            verticalalignment = 'top'
            y = y - .001
        plt.text(x, y, name, size=10,fontproperties = 'SimHei',
                 horizontalalignment=horizontalalignment,
                 verticalalignment=verticalalignment,
                 bbox=dict(facecolor='w',
                           edgecolor=plt.cm.nipy_spectral(label / float(n_labels)),
                           alpha=.6))

    plt.xlim(embedding[0].min() - .15 * embedding[0].ptp(),
             embedding[0].max() + .10 * embedding[0].ptp(),)
    plt.ylim(embedding[1].min() - .03 * embedding[1].ptp(),
             embedding[1].max() + .03 * embedding[1].ptp())

    plt.show()

stock_names=sz50_df2.loc[selected_stocks,:].name.tolist()
visual_stock_relationship(stock_dataset,edge_model,labels,stock_names)
the end of demo