echarts 地图3d+地图下钻
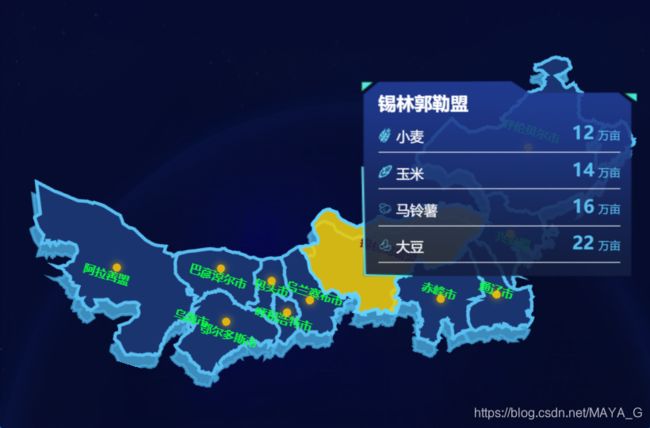
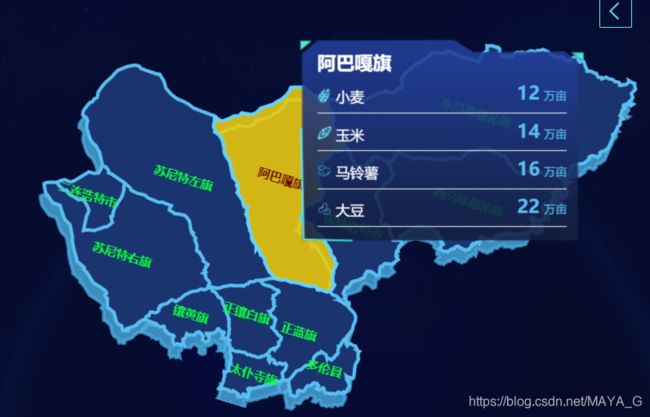
效果图
原理
使用geo下移叠加地图的阴影效果,通过点击地图获取当前点击的城市编码动态切换地json
// 地图数据 (用来标记地图名称的散点图及弹窗数据)
let dataset = [
{
name: '阿拉善盟',
wheat: 128,
corn: 100,
potato: 28,
soybeans: 234,
number: 152900,
coordinate: [102.42556, 40.532392]
},
{
name: '巴彦淖尔市',
wheat: 128,
corn: 100,
potato: 28,
soybeans: 234,
number: 150800,
coordinate: [107.575749, 41.673305]
},
{
name: '鄂尔多斯市',
wheat: 128,
corn: 100,
potato: 28,
soybeans: 234,
number: 150600,
coordinate: [108.63741, 39.765314]
},
{
name: '呼和浩特市',
wheat: 128,
corn: 100,
potato: 28,
soybeans: 234,
number: 150100,
coordinate: [111.50328, 40.797159]
},
{
name: '乌兰察布市',
wheat: 128,
corn: 100,
potato: 28,
soybeans: 234,
number: 150900,
coordinate: [112.443087, 41.506874]
},
{
name: '锡林郭勒盟',
wheat: 128,
corn: 100,
potato: 28,
soybeans: 234,
number: 152500,
coordinate: [115.46632, 43.942965]
},
{
name: '赤峰市',
wheat: 128,
corn: 100,
potato: 28,
soybeans: 234,
number: 150400,
coordinate: [118.878285, 43.039277]
},
{
name: '通辽市',
wheat: 128,
corn: 100,
potato: 28,
soybeans: 234,
number: 150500,
coordinate: [121.569548, 43.834485]
},
{
name: '兴安盟',
wheat: 128,
corn: 100,
potato: 28,
soybeans: 234,
number: 152200,
coordinate: [121.341355, 46.241397]
},
{
name: '包头市',
wheat: 128,
corn: 100,
potato: 28,
soybeans: 234,
number: 150200,
coordinate: [110.266038, 41.789669]
},
{
name: '呼伦贝尔市',
wheat: 128,
corn: 100,
potato: 28,
soybeans: 234,
number: 150700,
coordinate: [120.906868, 49.635235]
}
]
// 处理scatter散点图数据
function resetData(data) {
return data.map((item) => {
return {
name: item.name,
value: item.coordinate //坐标点
}
})
}
function initEachart(geoJson, name, chart) {
echarts.registerMap(name, geoJson);
let option2 = {
tooltip: {
trigger: 'item',
backgroundColor: 'rgba(0,0,0,0)',
borderColor: 'rgba(0,0,0,0)',
extraCssText: 'box-shadow: 0 0 0px rgba(0, 0, 0, 0);',
formatter: function (params) {
//调整tooltip的样式
let html = '' +
'' + params.name + '' +
'' +
'- ' +
'' +
'
 小麦' +
'' +
'12万亩' +
'
小麦' +
'' +
'12万亩' +
' ' +
'- ' +
'
 玉米' +
'14万亩' +
'
玉米' +
'14万亩' +
' ' +
'- ' +
'
 马铃薯' +
'16万亩' +
'
马铃薯' +
'16万亩' +
' ' +
'- ' +
'
 大豆' +
'22万亩' +
'
大豆' +
'22万亩' +
' ' +
'
' +
''
return html
}
},
geo: {
show: true,
map: name,
zoom: 1.2,
itemStyle: {
areaColor: '#1a346f',
borderColor: '#59bff0',
borderWidth: 4,
shadowColor: 'rgba(74,172,224, 0.8)',
shadowBlur: 0,
shadowOffsetX: 0,
shadowOffsetY: 16 //设置地图阴影
}
},
series: [
{
type: 'map',
zoom: 1.2,
mapType: name, // 自定义扩展图表类型
label: {
show: true,
color: '#0AFF3F',
fontSize: '0.17rem',
fontWeight: 'bold'
},
geoIndex: 1,
itemStyle: {
areaColor: '#1a346f',
borderColor: '#59bff0',
borderWidth: 4,
},
zlevel: 0
},
{
type: 'scatter',
coordinateSystem: 'geo',
data: resetData(dataset),
symbolSize: function (val) {
return 9;
},
seriesIndex: 22,
encode: {
value: 2
},
showEffectOn: 'render',
rippleEffect: {
brushType: 'stroke',
color: '#ffc600',
},
hoverAnimation: true,
label: {
show: false,
position: 'top',
color: '#0AFF3F',
fontWeight: 'bold',
fontSize: '0.2rem',
formatter: function (data) {
return data.name
}
},
itemStyle: {
shadowBlur: 10,
shadowColor: '#ffc600',
color: '#ffc600',
borderColor: '#ffc600'
},
emphasis: {
label: {
color: "#0AFF3F"
},
itemStyle: {
areaColor: '#ffc600'
}
},
zlevel: 333
}
]
}
chart.setOption(option2)
chart.off('click')
chart.on('click', function (params) {
// 接触地图点击高亮选中
chart.dispatchAction({
type: 'unselect',
seriesIndex: 0,
name: params.name
});
let index = dataset.map(item => item.name).indexOf(params.name)
if (index !== -1) {
getGeoJson('../js/' + dataset[index].number + '.json')
.then(regionGeoJson => {
dataset = []
// 展示返回按钮,返回内蒙古地图
$('.go-back-btn').show()
initEachart(regionGeoJson, params.name, chart)
}).catch(err => {
getGeoJson('../js/NeiMengGu.json', 'NMG', chart)
})
}
})
$(window).resize(function () {
chart.resize()
});
}
async function getGeoJson(jsonName) {
return await $.get(jsonName)
}
async function initChart() {
let chart = echarts.init(document.getElementById('mapCon'));
let json = await getGeoJson('../js/NeiMengGu.json')
initEachart(json, 'NMG', chart)
}