import pandas as pd
import numpy as np
from plotnine import *
import matplotlib.pyplot as plt
df=pd.read_csv('Stackedbar_Data.csv')
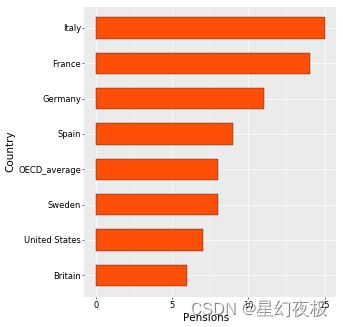
df=df.sort_values(by='Pensions', ascending=True)
df['Country']=df['Country'].astype("category",categories= df['Country'],ordered=True)
print(df.head())
base_plot=(ggplot(df,aes('Country','Pensions'))+
geom_bar(stat="identity", color="black", width=0.6,fill="#FC4E07",size=0.25) +
coord_flip()+
theme(
axis_title=element_text(size=15,face="plain",color="black"),
axis_text = element_text(size=12,face="plain",color="black"),
legend_title=element_text(size=13,face="plain",color="black"),
legend_position = "right",
aspect_ratio =1.15,
figure_size = (6.5, 6.5),
dpi = 50
))
print(base_plot)
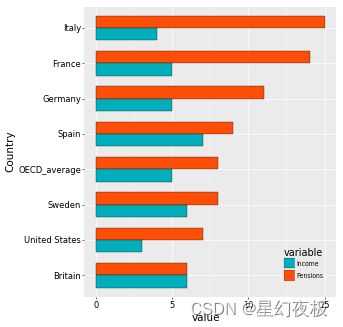
df=pd.read_csv('Stackedbar_Data.csv')
df=df.iloc[:,[0,2,1]]
df=df.sort_values(by='Pensions', ascending=True)
mydata=pd.melt(df,id_vars='Country')
mydata['Country']=mydata['Country'].astype("category",categories= df['Country'],ordered=True)
print(mydata.head())
base_plot=(ggplot(mydata,aes('Country','value',fill='variable'))+
geom_bar(stat="identity", color="black", position=position_dodge(),width=0.7,size=0.25)+
scale_fill_manual(values=("#00AFBB", "#FC4E07", "#E7B800"))+
coord_flip()+
theme(
axis_title=element_text(size=15,face="plain",color="black"),
axis_text = element_text(size=12,face="plain",color="black"),
legend_title=element_text(size=14,face="plain",color="black"),
legend_background =element_blank(),
legend_position = (0.8,0.2),
aspect_ratio =1.15,
figure_size = (6.5, 6.5),
dpi = 50
))
print(base_plot)
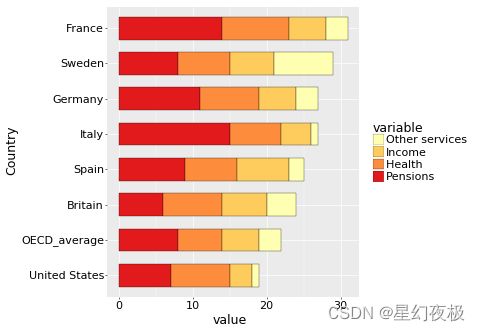
df=pd.read_csv('Stackedbar_Data.csv')
Sum_df=df.iloc[:,1:].apply(lambda x: x.sum(), axis=0).sort_values(ascending=True)
meanRow_df=df.iloc[:,1:].apply(lambda x: x.mean(), axis=1)
Sing_df=df['Country'][meanRow_df.sort_values(ascending=True).index]
mydata=pd.melt(df,id_vars='Country')
mydata['variable']=mydata['variable'].astype("category",categories= Sum_df.index,ordered=True)
mydata['Country']=mydata['Country'].astype("category",categories= Sing_df,ordered=True)
print(mydata.head())
base_plot=(ggplot(mydata,aes('Country','value',fill='variable'))+
geom_bar(stat="identity", color="black", position='stack',width=0.65,size=0.25)+
scale_fill_brewer(palette="YlOrRd")+
coord_flip()+
theme(
axis_title=element_text(size=18,face="plain",color="black"),
axis_text = element_text(size=16,face="plain",color="black"),
legend_title=element_text(size=18,face="plain",color="black"),
legend_text = element_text(size=16,face="plain",color="black"),
legend_background =element_blank(),
legend_position = 'right',
aspect_ratio =1.15,
figure_size = (6.5, 6.5),
dpi = 50
))
print(base_plot)
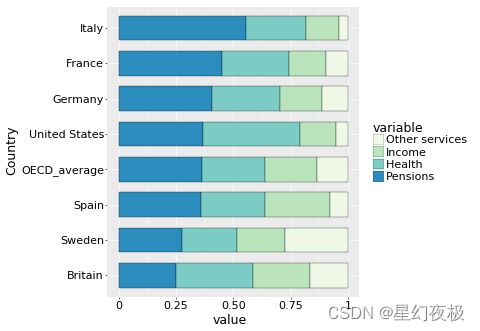
df=pd.read_csv('Stackedbar_Data.csv')
SumCol_df=df.iloc[:,1:].apply(lambda x: x.sum(), axis=1)
df.iloc[:,1:]=df.iloc[:,1:].apply(lambda x: x/SumCol_df, axis=0)
meanRow_df=df.iloc[:,1:].apply(lambda x: x.mean(), axis=0).sort_values(ascending=True)
Per_df=df.loc[:,meanRow_df.idxmax()].sort_values(ascending=True)
Sing_df=df['Country'][Per_df.index]
mydata=pd.melt(df,id_vars='Country')
mydata['Country']=mydata['Country'].astype("category",categories=Sing_df,ordered=True)
mydata['variable']=mydata['variable'].astype("category",categories= meanRow_df.index,ordered=True)
print(mydata.head())
base_plot=(ggplot(mydata,aes(x='Country',y='value',fill='variable'))
+geom_bar(stat="identity", color="black", position='fill',width=0.7,size=0.25)
+scale_fill_brewer(palette="GnBu")
+coord_flip()
+theme(
axis_title=element_text(size=18,face="plain",color="black"),
axis_text = element_text(size=16,face="plain",color="black"),
legend_title=element_text(size=18,face="plain",color="black"),
legend_text = element_text(size=16,face="plain",color="black"),
aspect_ratio =1.15,
figure_size = (6.5, 6.5),
dpi = 50
)
)
print(base_plot)