springboot 的监控系统actuator
SpringBoot监控管理
微服务的特点决定了功能模块的部署是分布式的,大部分功能模块都是运行在不同的机器上,彼此通过服务调用进行交互,前后台的业务流会经过很多个微服务的处理和传递,出现了异常如何快速定位是哪个环节出现了问题?
在这种框架下,微服务的监控显得尤为重要。Spring Boot 给了我们解决方案。通过引入spring-boot-starter-actuator,可以使用Spring Boot为我们提供的准生产环境下的应用监控和管理功能。我们可以通过HTTP,JMX,SSH协议来进行操作,自动得到审计、健康及指标信息等
- 引入spring-boot-starter-actuator
- 通过http方式访问监控端点
- 可进行shutdown(POST 提交,此端点默认关闭)
SpringBoot Actuator的使用
在Spring boot应用中,要实现可监控的功能,依赖的是 spring-boot-starter-actuator 这个组件。它提供了很多监控和管理你的spring boot应用的HTTP或者JMX端点,并且你可以有选择地开启和关闭部分功能。当你的spring boot应用中引入下面的依赖之后,将自动的拥有审计、健康检查、Metrics监控功能。
<!-- web start-->
>
>org.springframework.boot >
>spring-boot-starter-web >
>
<!-- web end-->
<!-- actuator start-->
>
>org.springframework.boot >
>spring-boot-starter-actuator >
>
<!-- actuator end-->
具体的使用方法:
引入上述的依赖jar
通过下面的配置启用所有的监控端点,默认情况下,这些端点是禁用的;
management:
  endpoints:
    web:
      exposure:
        include: "*"
        # “*”号代表启用所有的监控端点,可以单独启用,例如,`health`,`info`,`metrics`等
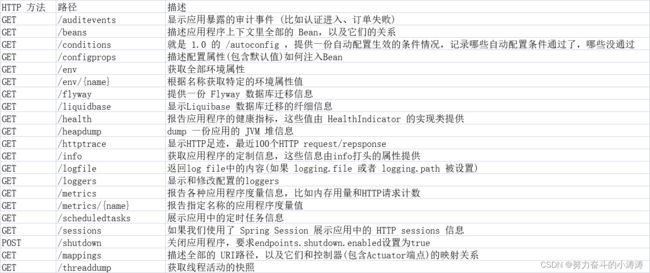
Actuator 的 REST 接口
Actuator 监控分成两类:原生端点和用户自定义端点;自定义端点主要是指扩展性,用户可以根据自己的实际应用,定义一些比较关心的指标,在运行期进行监控。
原生端点是在应用程序里提供众多 Web 接口,通过它们了解应用程序运行时的内部状况。原生端点又可以分成三类:
- 应用配置类:可以查看应用在运行期的静态信息:例如自动配置信息、加载的 springbean 信息、yml 文件配置信息、环境信息、请求映射信息;
- 度量指标类:主要是运行期的动态信息,例如堆栈、请求连、一些健康指标、metrics 信息等;
- 操作控制类:主要是指 shutdown,用户可以发送一个请求将应用的监控功能关闭。
Actuator 提供了 13 个接口,具体如下表所示。
命令详解
在 Spring Boot 2.x 中为了安全期间,Actuator 只开放了两个端点 /actuator/health 和 /actuator/info。可以在配置文件中设置打开。
可以打开所有的监控点
management.endpoints.web.exposure.include=*
也可以选择打开部分
management.endpoints.web.exposure.exclude=beans,trace
Actuator 默认所有的监控点路径都在/actuator/*,当然如果有需要这个路径也支持定制。
management.endpoints.web.base-path=/manage
设置完重启后,再次访问地址就会变成/manage/*
Actuator 几乎监控了应用涉及的方方面面,我们重点讲述一些经常在项目中常用的命令。
health
health 主要用来检查应用的运行状态,这是我们使用最高频的一个监控点。通常使用此接口提醒我们应用实例的运行状态,以及应用不”健康“的原因,比如数据库连接、磁盘空间不够等。
默认情况下 health 的状态是开放的,添加依赖后启动项目,访问:http://localhost:8080/actuator/health即可看到应用的状态。
{
    "status" : "UP"
}
要想查看详细的应用健康信息需要配置management.endpoint.health.show-details 的值为always,配置之后我们再次访问http://localhost:8080/actuator/health,获取的信息如下:
{
    "status": "UP",
    "components": {
    "diskSpace": {
    "status": "UP",
    "details": {
    "total": 236510507008,
    "free": 223361744896,
    "threshold": 10485760
}
},
"ping": {
    "status": "UP"
}
}
}
Spring boot的健康信息都是从ApplicationContext中的各种HealthIndicator Beans中收集到的,Spring boot框架中包含了大量的HealthIndicators的实现类,当然你也可以实现自己认为的健康状态。
默认情况下,最终的 Spring Boot 应用的状态是由 HealthAggregator 汇总而成的,汇总的算法是:
1 设置状态码顺序:setStatusOrder(Status.DOWN, Status.OUT_OF_SERVICE, Status.UP, Status.UNKNOWN);。
2 过滤掉不能识别的状态码。
3 如果无任何状态码,整个 Spring Boot 应用的状态是 UNKNOWN。
4 将所有收集到的状态码按照 1 中的顺序排序。
5 返回有序状态码序列中的第一个状态码,作为整个 Spring Boot 应用的状态。
health 通过合并几个健康指数检查应用的健康情况。Spring boot框架自带的 HealthIndicators 目前包括:
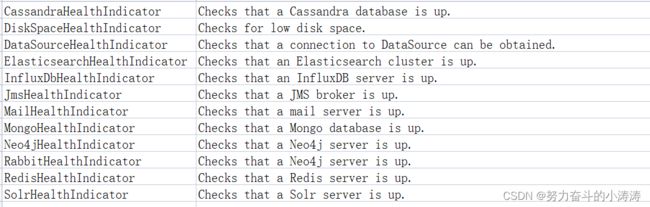
举个例子,如果你的应用使用 Redis,RedisHealthindicator 将被当作检查的一部分;如果使用 MongoDB,那么MongoHealthIndicator 将被当作检查的一部分。
可以在配置文件中关闭特定的健康检查指标,比如关闭 redis 的健康检查:
management.health.redise.enabled=false
自定义 HealthIndicator 健康检查
有时候需要提供自定义的健康状态检查信息,你可以通过实现HealthIndicator的接口来实现,并将该实现类注册为spring bean。你需要实现其中的health()方法,并返回自定义的健康状态响应信息,该响应信息应该包括一个状态码和要展示详细信息。例如,下面就是一个接口HealthIndicator的实现类:
@Component
public class MyHealthIndicator implements HealthIndicator {

    @Override
    public Health health() {
        int errorCode = check(); // perform some specific health check
        if (errorCode != 0) {
            return Health.down().withDetail("Error Code", errorCode).build();
        }
        return Health.up().build();
    }

}
另外,除了Spring boot定义的几个状态类型,我们也可以自定义状态类型,用来表示一个新的系统状态。在这种情况下,你还需要实现接口 HealthAggregator ,或者通过配置 management.health.status.order 来继续使用HealthAggregator的默认实现。
例如,在你自定义的健康检查HealthIndicator的实现类中,使用了自定义的状态类型FATAL,为了配置该状态类型的严重程度,你需要在application的配置文件中添加如下配置:
management.health.status.order=FATAL, DOWN, OUT_OF_SERVICE, UNKNOWN, UP
在做健康检查时,响应中的HTTP状态码反应了整体的健康状态,(例如,UP 对应 200, 而 OUT_OF_SERVICE 和 DOWN 对应 503)。同样,你也需要为自定义的状态类型设置对应的HTTP状态码,例如,下面的配置可以将 FATAL 映射为 503(服务不可用):
management.health.status.http-mapping.FATAL=503
下面是内置健康状态类型对应的HTTP状态码列表:
| Status | Mapping |
|---|---|
| OUT_OF_SERVICE | SERVICE_UNAVAILABLE (503) |
| DOWN | SERVICE_UNAVAILABLE (503) |
| UP | No mapping by default, so http status is 200 |
| UNKNOWN | No mapping by default, so http status is 200 |
info
info 就是我们自己配置在配置文件中以 info 开头的配置信息,比如我们在示例项目中的配置是:
info.app.name=spring-boot-actuator
info.app.version= 1.0.0
info.app.test= test
启动示例项目,访问:http://localhost:8080/actuator/info返回部分信息如下:
{
  "app": {
    "name": "spring-boot-actuator",
    "version": "1.0.0",
    "test":"test"
  }
}
beans
根据示例就可以看出,展示了 bean 的别名、类型、是否单例、类的地址、依赖等信息。
启动示例项目,访问:http://localhost:8080/actuator/beans返回部分信息如下:
[
  {
    "context": "application:8080:management",
    "parent": "application:8080",
    "beans": [
      {
        "bean": "embeddedServletContainerFactory",
        "aliases": [

        ],
        "scope": "singleton",
        "type": "org.springframework.boot.context.embedded.tomcat.TomcatEmbeddedServletContainerFactory",
        "resource": "null",
        "dependencies": [

        ]
      },
      {
        "bean": "endpointWebMvcChildContextConfiguration",
        "aliases": [

        ],
        "scope": "singleton",
        "type": "org.springframework.boot.actuate.autoconfigure.EndpointWebMvcChildContextConfiguration$$EnhancerBySpringCGLIB$$a4a10f9d",
        "resource": "null",
        "dependencies": [

        ]
      }
  }
]
conditions
Spring Boot 的自动配置功能非常便利,但有时候也意味着出问题比较难找出具体的原因。使用 conditions 可以在应用运行时查看代码了某个配置在什么条件下生效,或者某个自动配置为什么没有生效。
启动示例项目,访问:http://localhost:8080/actuator/conditions返回部分信息如下:
{
    "positiveMatches": {
     "DevToolsDataSourceAutoConfiguration": {
            "notMatched": [
                {
                    "condition": "DevToolsDataSourceAutoConfiguration.DevToolsDataSourceCondition",
                    "message": "DevTools DataSource Condition did not find a single DataSource bean"
                }
            ],
            "matched": [ ]
        },
        "RemoteDevToolsAutoConfiguration": {
            "notMatched": [
                {
                    "condition": "OnPropertyCondition",
                    "message": "@ConditionalOnProperty (spring.devtools.remote.secret) did not find property 'secret'"
                }
            ],
            "matched": [
                {
                    "condition": "OnClassCondition",
                    "message": "@ConditionalOnClass found required classes 'javax.servlet.Filter', 'org.springframework.http.server.ServerHttpRequest'; @ConditionalOnMissingClass did not find unwanted class"
                }
            ]
        }
    }
}
heapdump
返回一个 GZip 压缩的 JVM 堆 dump
启动示例项目,访问:http://localhost:8080/actuator/heapdump会自动生成一个 Jvm 的堆文件 heapdump,我们可以使用 JDK 自带的 Jvm 监控工具 VisualVM 打开此文件查看内存快照。类似如下图:

shutdown
开启接口优雅关闭 Spring Boot 应用,要使用这个功能首先需要在配置文件中开启:
management.endpoint.shutdown.enabled=true
配置完成之后,启动示例项目,使用 curl 模拟 post 请求访问 shutdown 接口。
shutdown 接口默认只支持 post 请求。
curl -X POST "http://localhost:8080/actuator/shutdown"
{
    "message": "Shutting down, bye..."
}
此时你会发现应用已经被关闭。
mappings
描述全部的 URI 路径,以及它们和控制器的映射关系
启动示例项目,访问:http://localhost:8080/actuator/mappings返回部分信息如下:
{
  "/**/favicon.ico": {
    "bean": "faviconHandlerMapping"
  },
  "{[/hello]}": {
    "bean": "requestMappingHandlerMapping",
    "method": "public java.lang.String com.neo.controller.HelloController.index()"
  },
  "{[/error]}": {
    "bean": "requestMappingHandlerMapping",
    "method": "public org.springframework.http.ResponseEntity> org.springframework.boot.autoconfigure.web.BasicErrorController.error(javax.servlet.http.HttpServletRequest)"
  }
}
threaddump
/threaddump 接口会生成当前线程活动的快照。这个功能非常好,方便我们在日常定位问题的时候查看线程的情况。 主要展示了线程名、线程ID、线程的状态、是否等待锁资源等信息。
启动示例项目,访问:http://localhost:8080/actuator/threaddump返回部分信息如下:
[
  {
    "threadName": "http-nio-8088-exec-6",
    "threadId": 49,
    "blockedTime": -1,
    "blockedCount": 0,
    "waitedTime": -1,
    "waitedCount": 2,
    "lockName": "java.util.concurrent.locks.AbstractQueuedSynchronizer$ConditionObject@1630a501",
    "lockOwnerId": -1,
    "lockOwnerName": null,
    "inNative": false,
    "suspended": false,
    "threadState": "WAITING",
    "stackTrace": [
      {
        "methodName": "park",
        "fileName": "Unsafe.java",
        "lineNumber": -2,
        "className": "sun.misc.Unsafe",
        "nativeMethod": true
      },
      ...
      {
        "methodName": "run",
        "fileName": "TaskThread.java",
        "lineNumber": 61,
        "className": "org.apache.tomcat.util.threads.TaskThread$WrappingRunnable",
        "nativeMethod": false
      }
      ...
    ],
    "lockInfo": {
      "className": "java.util.concurrent.locks.AbstractQueuedSynchronizer$ConditionObject",
      "identityHashCode": 372286721
    }
  }
  ...
]