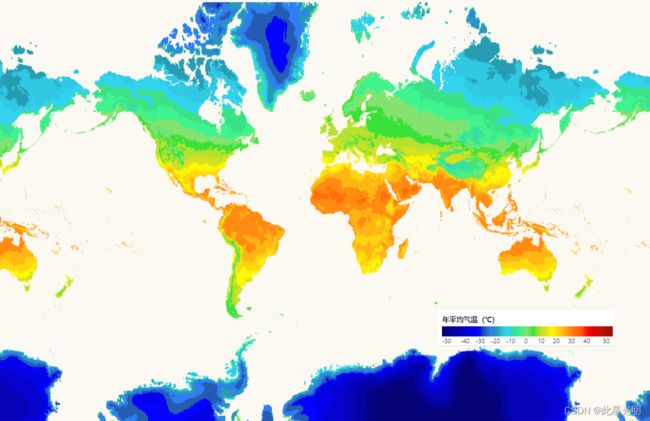
全球10m生物气候产品
简介
生物气候变量来源于月温度和月降雨量,常用于物种分布模型和生态相关模型等。生物气候变量反映年度趋势、季节性、极端或限制性环境因素。前言 – 人工智能教程
生物气候是指生物和气候之间的相互作用和影响。生物影响气候的方式有很多,包括植物的光合作用、蒸腾作用、放射作用、土壤微生物代谢作用等等,而气候也会对生物产生很大的影响,包括温度、湿度、日照、降水等等因素。生物和气候之间相互作用的结果,对整个生态系统的发展和演替产生很大的影响,影响着生态系统的结构、功能和稳定性。生物气候研究的主要目的是揭示生物系统与气候系统之间的相互作用机理,从而更好地了解和保护生态系统。
数据集ID:
WORLDCLIME/BIO_10M
时间范围: 1970年-2000年
范围: 全球
来源: WorldClim
复制代码段:
var images = pie.ImageCollection("WORLDCLIME/BIO_10M")
波段
| 称 | 分辨率(minutes) | 类型 | 无效值 | 描述信息 |
|---|---|---|---|---|
| BIO1 | 10 | Float32 | -9999 | Annual Mean Temperature |
| BIO2 | 10 | Float32 | -9999 | Mean Diurnal Range (Mean of monthly (max temp - min temp)) |
| BIO3 | 10 | Float32 | -9999 | Isothermality (BIO2/BIO7) (×100) |
| BIO4 | 10 | Float32 | -9999 | Temperature Seasonality (standard deviation ×100) |
| BIO5 | 10 | Float32 | -9999 | Max Temperature of Warmest Month |
| BIO6 | 10 | Float32 | -9999 | Min Temperature of Coldest Month |
| BIO7 | 10 | Float32 | -9999 | Temperature Annual Range (BIO5-BIO6) |
| BIO8 | 10 | Float32 | -9999 | Mean Temperature of Wettest Quarter |
| BIO09 | 10 | Float32 | -9999 | Mean Temperature of Driest Quarter |
| BIO10 | 10 | Float32 | -9999 | Mean Temperature of Warmest Quarter |
| BIO11 | 10 | Float32 | -9999 | Mean Temperature of Coldest Quarter |
| BIO12 | 10 | Float32 | -9999 | Annual Precipitation |
| BIO13 | 10 | Float32 | -9999 | Precipitation of Wettest Month |
| BIO14 | 10 | Float32 | -9999 | Precipitation of Driest Month |
| BIO15 | 10 | Float32 | -9999 | Precipitation Seasonality (Coefficient of Variation) |
| BIO16 | 10 | Float32 | -9999 | Precipitation of Wettest Quarter |
| BIO17 | 10 | Float32 | -9999 | Precipitation of Driest Quarter |
| BIO18 | 10 | Float32 | -9999 | Precipitation of Warmest Quarter |
| BIO19 | 10 | Float32 | -9999 | Precipitation of Coldest Quarter |
| date |
string |
影像时间 |
代码:
/**
* @File    :   WORLDCLIME/BIO_10M
* @Time    :   2021/05/20
* @Author  :   piesat
* @Version :   1.0
* @Contact :   400-890-0662
* @License :   (C)Copyright 航天宏图信息技术股份有限公司
* @Desc    :   加载全球10m生物气候产品
*/

//加载全球10m生物气候数据
var img = pie.ImageCollection("WORLDCLIME/BIO_10M")
            .select("BIO1")
            .first();
//输出影像信息
print(img);
//定位地图中心
Map.centerObject(img, 1);
//设定预览参数
visParams = {min: -50, max: 50,
            palette: ['040274', '040281', '0502a3', '0502b8', '0502ce', '0502e6',
                        '0602ff', '235cb1', '307ef3', '269db1', '30c8e2', '32d3ef',
                        '3be285', '3ff38f', '86e26f', '3ae237', 'b5e22e', 'd6e21f',
                        'fff705', 'ffd611', 'ffb613', 'ff8b13', 'ff6e08', 'ff500d',
                        'ff0000', 'de0101', 'c21301', 'a71001', '911003']};
//加载影像
Map.addLayer(img, visParams, "img");
//图例
var data = {title: "年平均气温(℃)",
            colors: ['#040274', '#040281', '#0502a3', '#0502b8', '#0502ce', '#0502e6',
                    '#0602ff', '#235cb1', '#307ef3', '#269db1', '#30c8e2', '#32d3ef',
                    '#3be285', '#3ff38f', '#86e26f', '#3ae237', '#b5e22e', '#d6e21f',
                    '#fff705', '#ffd611', '#ffb613', '#ff8b13', '#ff6e08', '#ff500d',
                    '#ff0000', '#de0101', '#c21301', '#a71001', '#911003'],
            labels: ["-50", "-40", "-30", "-20", "-10", "0", "10", "20", "30", "40", "50"],
            step: 30};
var style = {left: "60%", top: "70%", height: "70px", width: "350px"};
var legend = ui.Legend(data, style);
Map.addUI(legend);